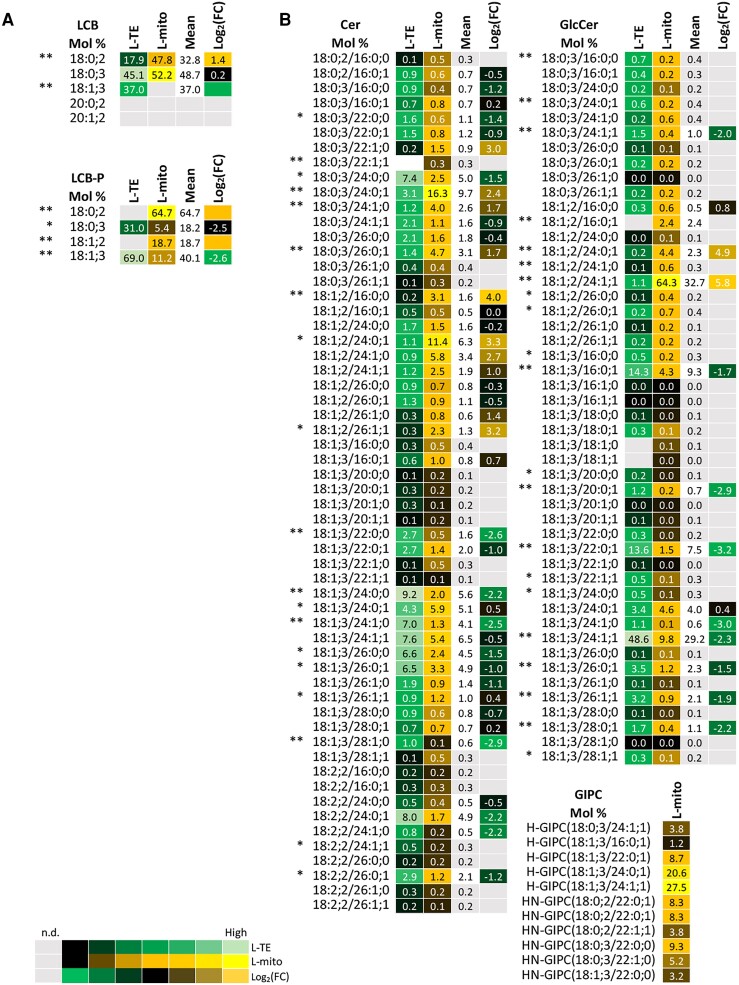
Figure 5.
Profiles of the distribution and fold changes (FC) of the molecular sphingolipid species between total extracts and mitochondrial fractions isolated from Arabidopsis leaves (L-mito and L-TE). Heat map visualizations of (A) LCB, LCB-P, and (B) complex sphingolipids illustrate the difference of species distribution based on liquid chromatography tandem mass spectrometry (LC–MS/MS) analyses. Each lipid class is represented by one set of joined columns. Identity of columns in each set from left to right: Column 1 lists the individual lipid class and the identity of the detected molecular lipid species. Column 2 (L-TE) lists the respective distribution of each molecular species in L-TE, expressed as the mean of its relative values (mol %) in the three independent experiments also used for proteomics and for glycerolipid and sterol analysis (Figures 1, 3 and 6; Supplemental Table 1). Column 3 (L-mito) lists the respective distribution of each molecular species in L-mito, expressed as the mean of its relative values (mol %) in the three independent experiments also used for proteomics. Column 4 lists the mean distribution of both sample types, and column 5 (Log2(FC)) lists the binary logarithm of fold change. Binary logarithm was applied when the mean values are higher than 0.5 to inspect the FC between L-mito and L-TE. The heat map colors represent mean intensity values according to the color map on the low left-hand side. *, ** indicate P values <0.05 and <0.01, respectively, by Student's t-test. LCB, long-chain base; LCB-P, long chain base-phosphate; Cer, ceramide; GlcCer, glycosylceramide; GIPC, glycosyl inositol phosphoceramide.

