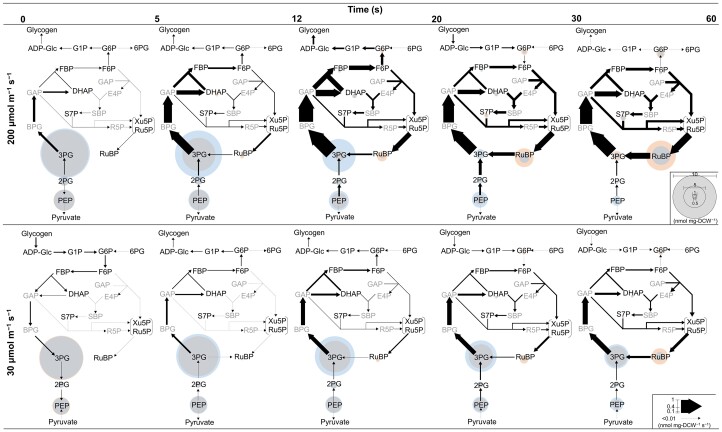
Figure 4.
Estimated change in metabolic flux after initiation of light irradiation at 200 μmol m−2 s−1 (upper row) and 30 μmol m−2 s−1 (lower row). Metabolic fluxes are indicated by the thickness of arrows with values indicated by the scale bar in the lower right corner. Metabolite concentrations (except glycogen) at the beginning and end of each time interval are indicated by the diameters of blue and orange circles, respectively. Overlap between orange and blue circles (namely invariant concentration during a time interval) is shown in gray. Abbreviations are the same as in the Figure 2 legend.

