
Extended Data Fig. 7 |. CD40L, ECM, and hydrogel stiffness regulate TLR9 and pSRC expression in PDX organoids.
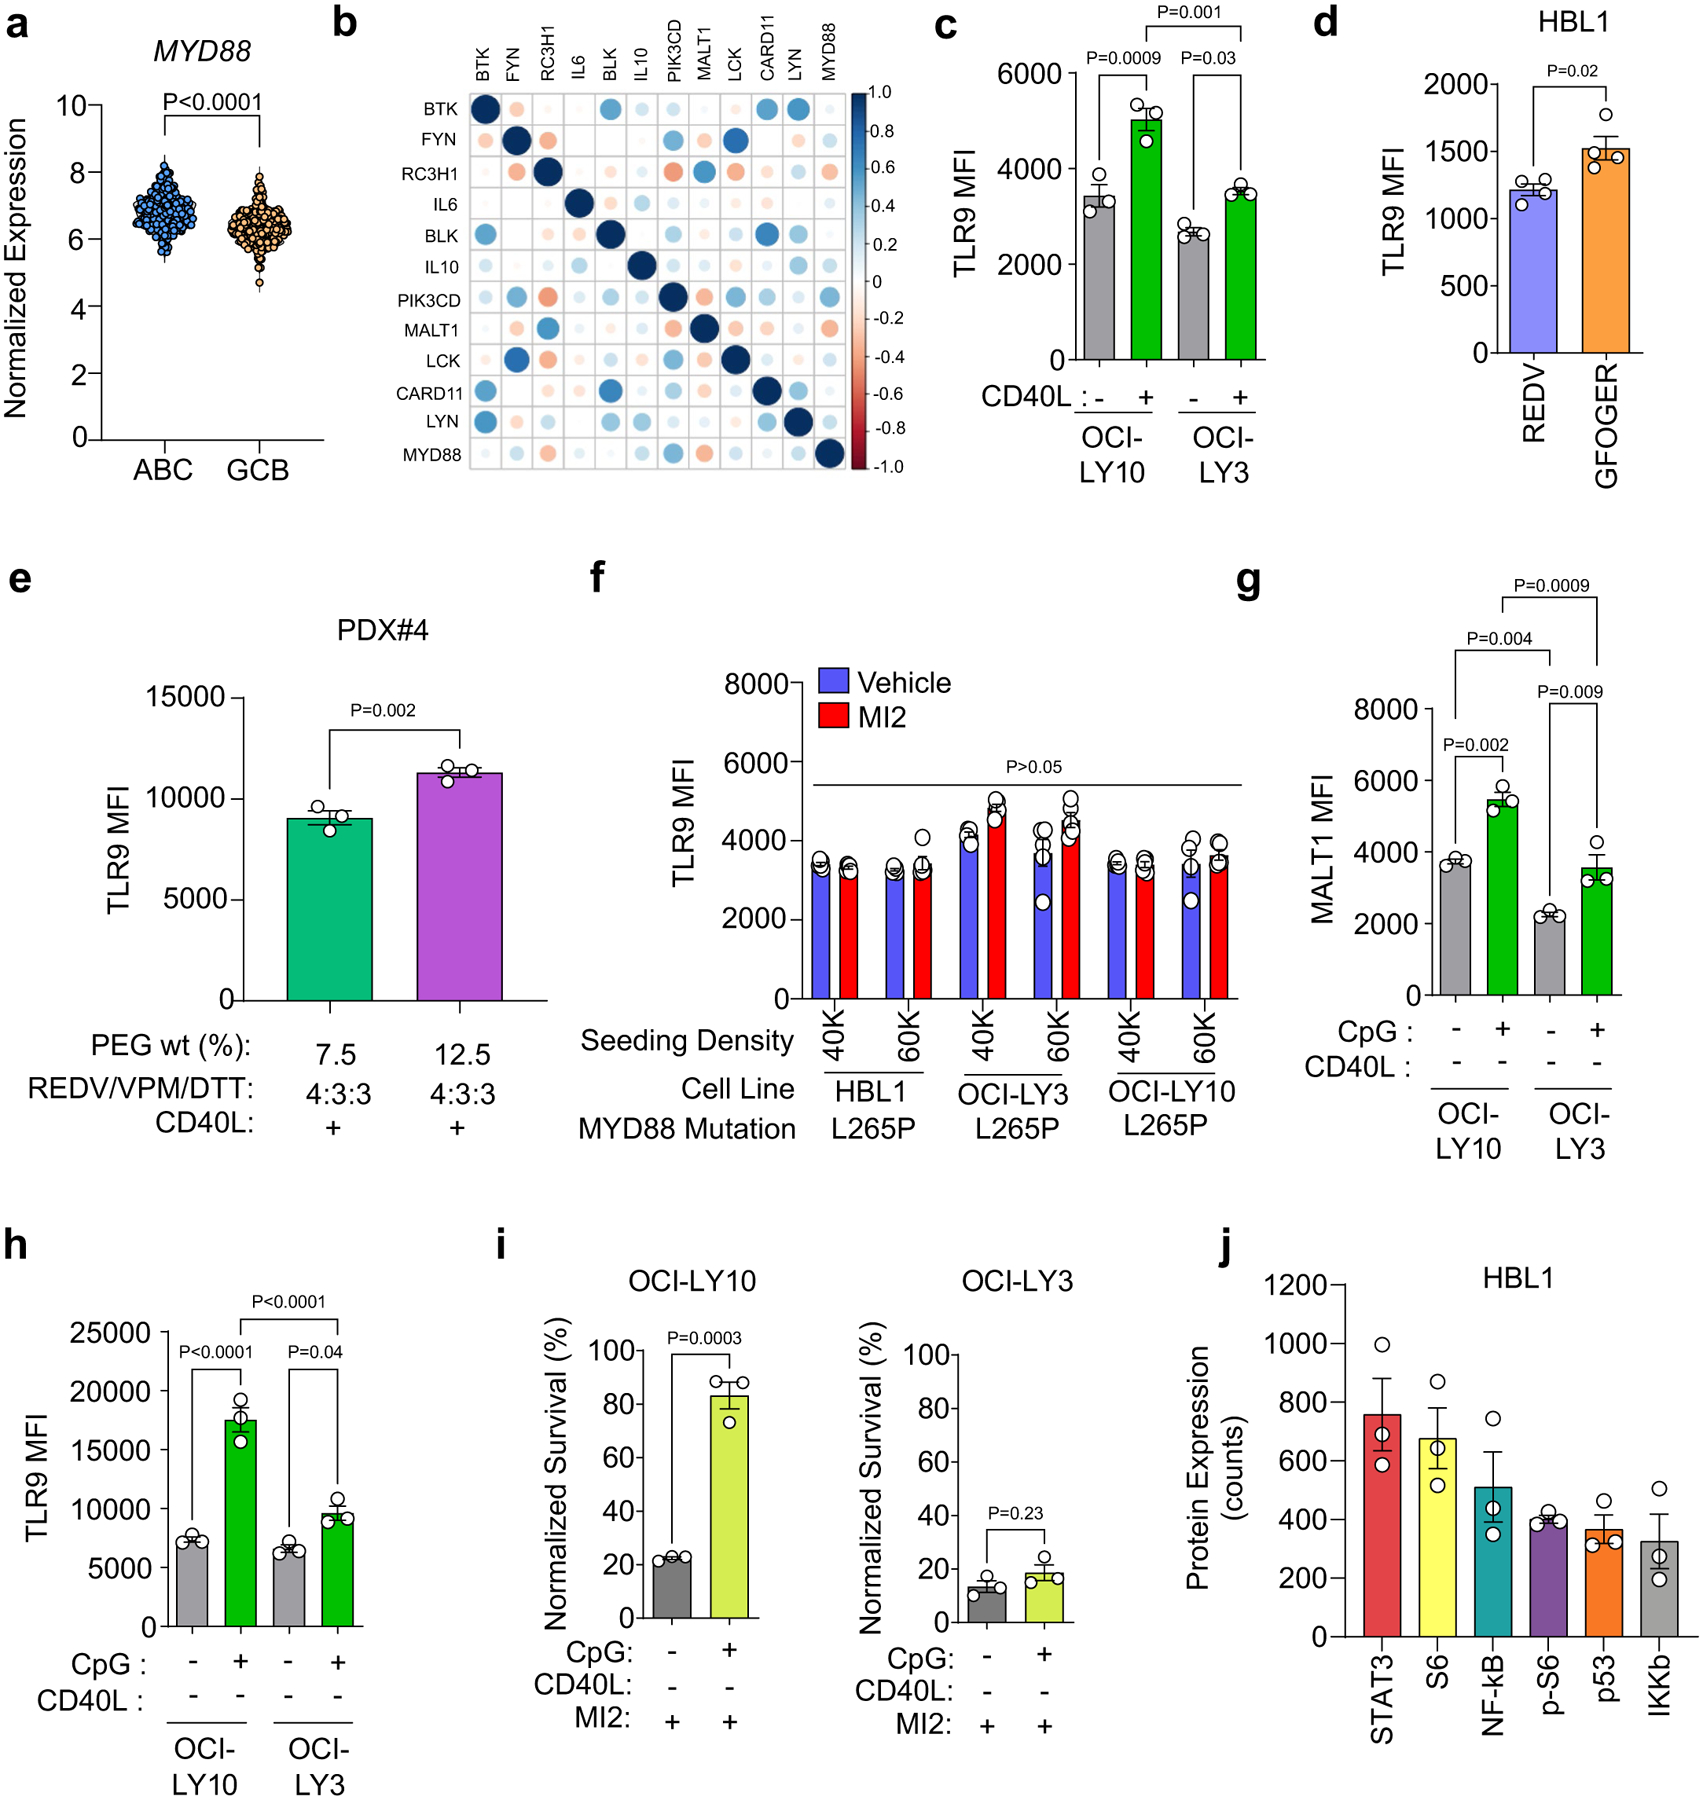
a, Gene expression of MYD88 in ABC-DLBCL (n = 242) and GCB-DLBCL (n = 264) patients from the HMRC cohort. Data were quantile normalized and log2 transformed. Two-tailed unpaired t-test. b, Pearson’s correlations for the genes of interest in the ABC-DLBCL (n = 242) samples. c, TLR9 median fluorescent intensity (MFI) for OCI-LY10 and OCI-LY3 cells cultured in ± CD40L-stromal cells conditions for 96 h. One-way ANOVA with Tukey’s multiple-comparison test (mean ± s.e.m., n = 3). d, TLR9 MFI for human ABC-DLBCL HBL1 cells cultured in REDV or GFOGER-functionalized organoids without CD40L-stromal cells for 96 h. Two-tailed unpaired t-test (mean ± s.e.m., n = 4). e, Effect of stiffness, modulated by indicated PEG-4MAL macromer densities (w/v%) at 4:3:3 REDV to VPM and DTT crosslinkers, on TLR9 in human PDX cells after 96-h culture Two-tailed unpaired t-test (mean ± s.e.m., n = 5) f, TLR9 MFI for human ABC-DLBCL cells cultured in REDV-presenting hydrogels for 96 h with different cell seeding density. In indicated groups (red), MI2 was added at 2000 nM for the last 48 h of culture. Two-tailed unpaired t-test for each cell line (mean ± s.e.m., n = 5). g-h, Effect of 1 μM CpG addition on MALT1 (g) and TLR9 (h) expression in cells cultured in REDV-functionalized hydrogel-based organoids for 96 h. One-way ANOVA with Tukey’s multiple-comparison test (mean ± s.e.m., n = 3). i, Survival (normalized to vehicle-treated) of OCI-LY10 and OCI-LY3 cells cultured in REDV-functionalized hydrogel-based organoids without and with 1 μM CpG for 96 h, including 48 h of 2000 nM MI2 treatment. Two-tailed unpaired t-test (mean ± s.e.m., n = 3). j, Protein expression of the six highest expressed proteins measured via NanoString nCounter SPRINT Profiler in HBL1 cells after 96-h culture in REDV-functionalized organoids with 1 μM CpG. mean ± s.e.m., n = 3 replicates each representing 60 organoids.