
Fig. 2 |. T-cell signal amplifies BCR pathway and attenuates the therapeutic response to MALT1 inhibition in ABC-DLBCLs.
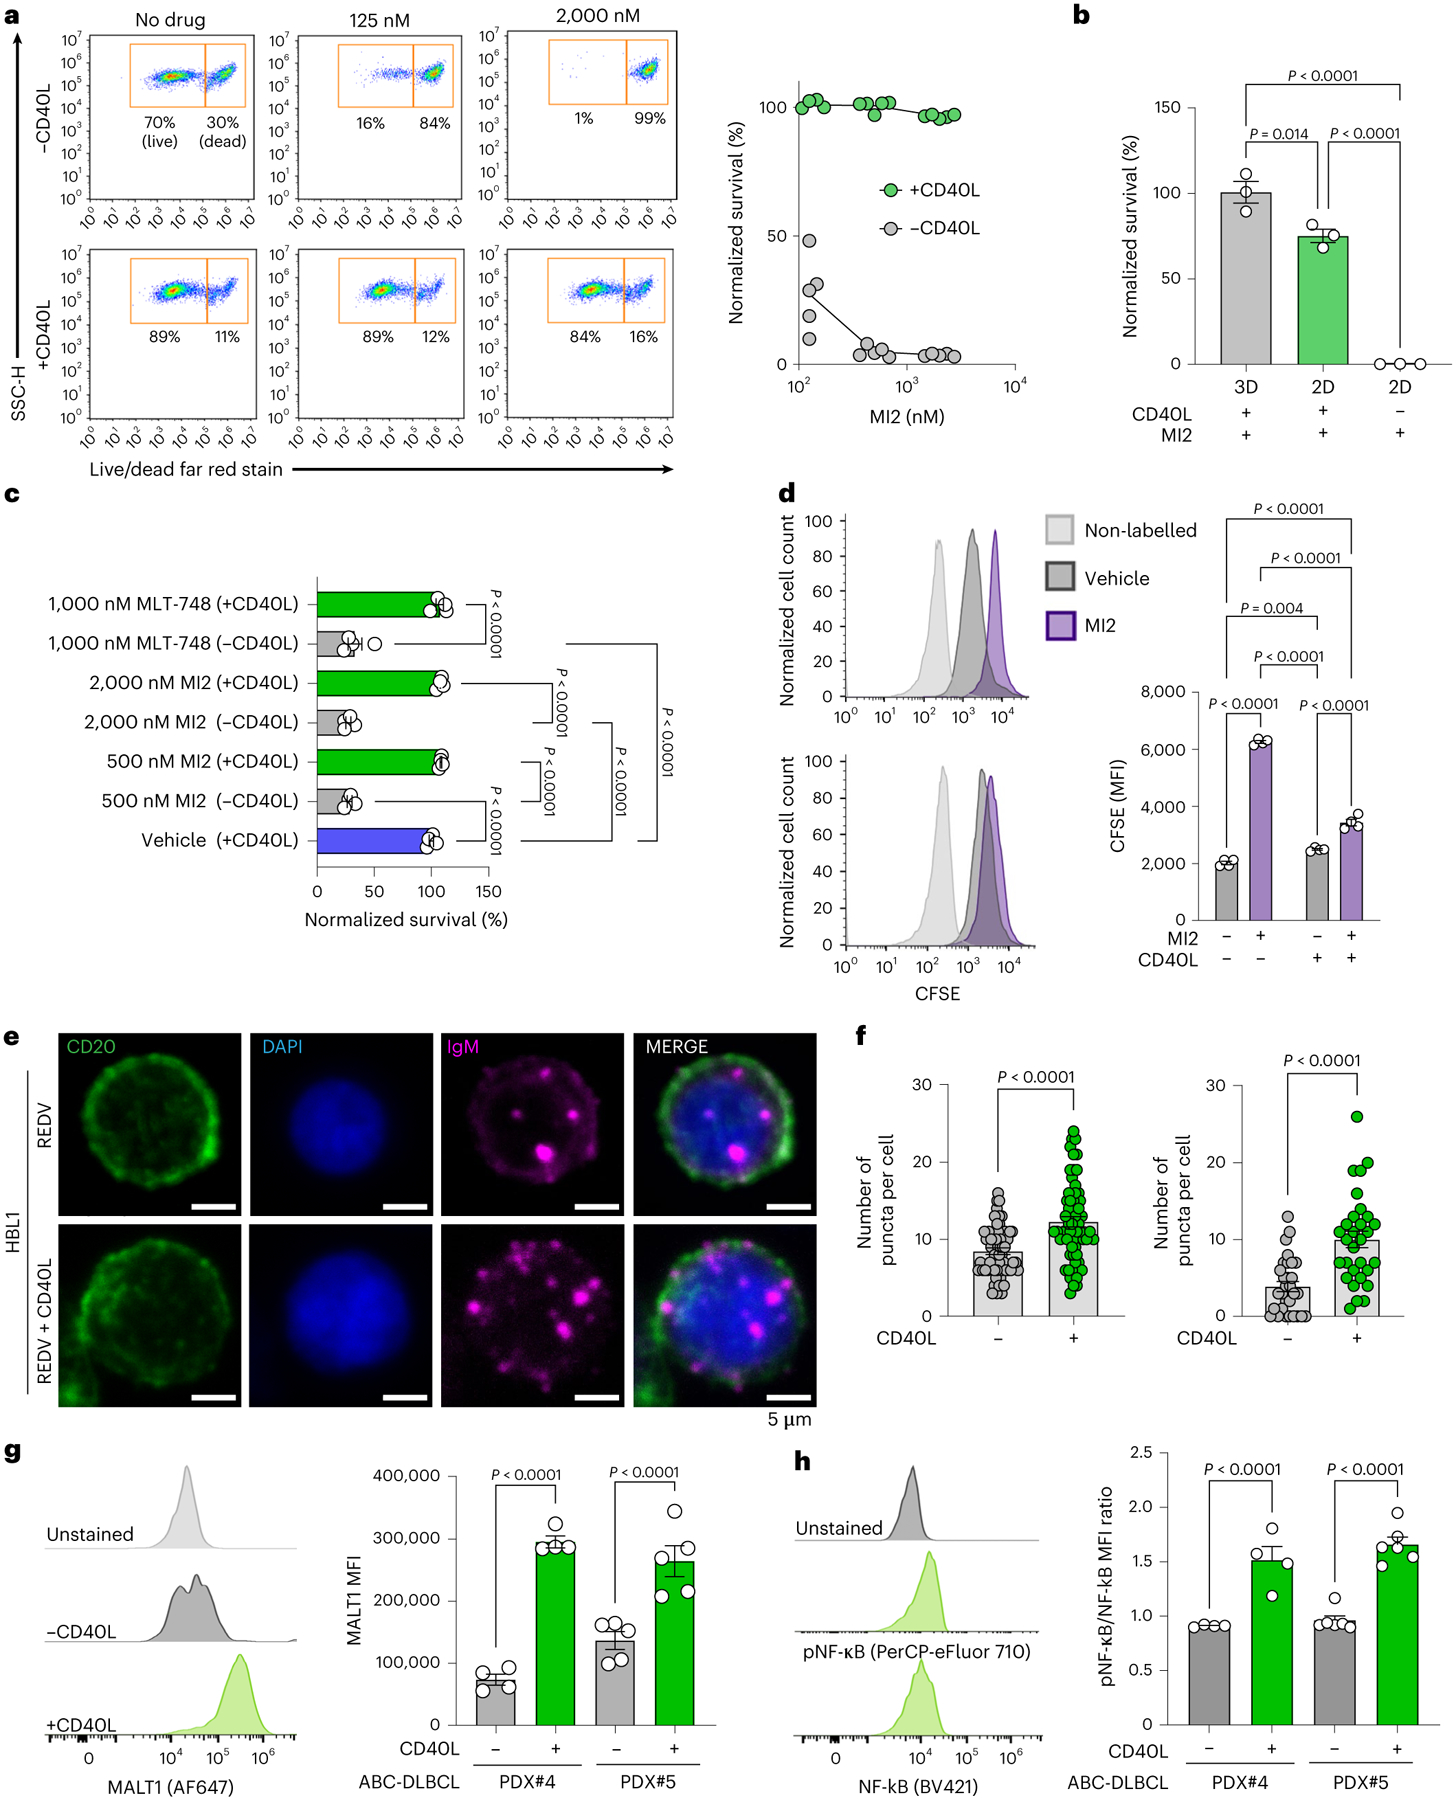
a, Left: flow cytometry gating of side scatter pulse height (SSC-H) versus live/dead. Right: survival (normalized to vehicle-treated) of ABC-DLBCL HBL1 cells cultured with or without CD40L-stromal cells after 48 h of culture and subsequent 48 h of treatment with increasing concentration of MALT1 inhibitor MI2 (n = 5). b, Survival (normalized to vehicle-treated) of human ABC-DLBCL HBL1 cells cultured in organoids or 2D with and without CD40L after 48 h culture, followed by 48 h treatment with 2,000 nM MALT1 inhibitor MI2. Two-tailed unpaired t-test (mean ± s.e.m., n = 3). c, Survival (normalized to vehicle-treated) of human ABC-DLBCL PDX#4 cultured in organoids with and without CD40L-expressing cells after 48 h culture, followed by 48 h treatment with 500 or 2,000 nM MI2 or 1,000 nM MLT-748. One-way ANOVA with Tukey’s multiple-comparison test (mean ± s.e.m., n = 4, PDX#4; n = 5, PDX#5). d, Proliferation after prelabelling cells with CFSE and subsequent 48 h culture, followed by 48 h treatment with 2,000 nM MI2. Left: flow cytometry histograms: HBL (top); HBL1 + CD40L (bottom). Right: quantification of CFSE for each culture condition. Two-tailed unpaired t-test (mean ± s.e.m., n = 4). MFI, median fluorescent intensity. e, BCR (magenta) puncta expression at the single-cell level on CD20 (green) expressing HBL1 in the presence or absence of CD40L-stromal cells, with DAPI (blue). Image representative of n = 5 hydrogels per condition. f, Number of BCR puncta per cell of ABC-DLBCL OCI-LY10 (left) and ABC-DLBCL HBL1 (right) cells cultured in ±CD40L-stromal cell conditions for 96 h. Two-tailed unpaired t-test (n = 5 hydrogels per cell line with 6 cells analysed per hydrogel for HBL1 and 12 cells analysed per hydrogel for OCI-LY10). g, Left: flow cytometry histograms. Right: MFI of MALT1 in human ABC-DLBCL PDX cells cultured in ±CD40L-stromal cell conditions for 96 h. Two-tailed unpaired t-test (mean ± s.e.m., n = 4 for PDX#4; n = 5 for PDX#5). h, Left: flow cytometry histograms. Right: ratio of MFI of pNF-κB/NF-κB in human ABC-DLBCL PDX cells cultured in ±CD40L-stromal cell conditions for 96 h. Two-tailed unpaired t-test (mean ± s.e.m., n = 4 for PDX#4; n = 5 for PDX#5). Each dot in a–d, g and h represents a hydrogel-based organoid.