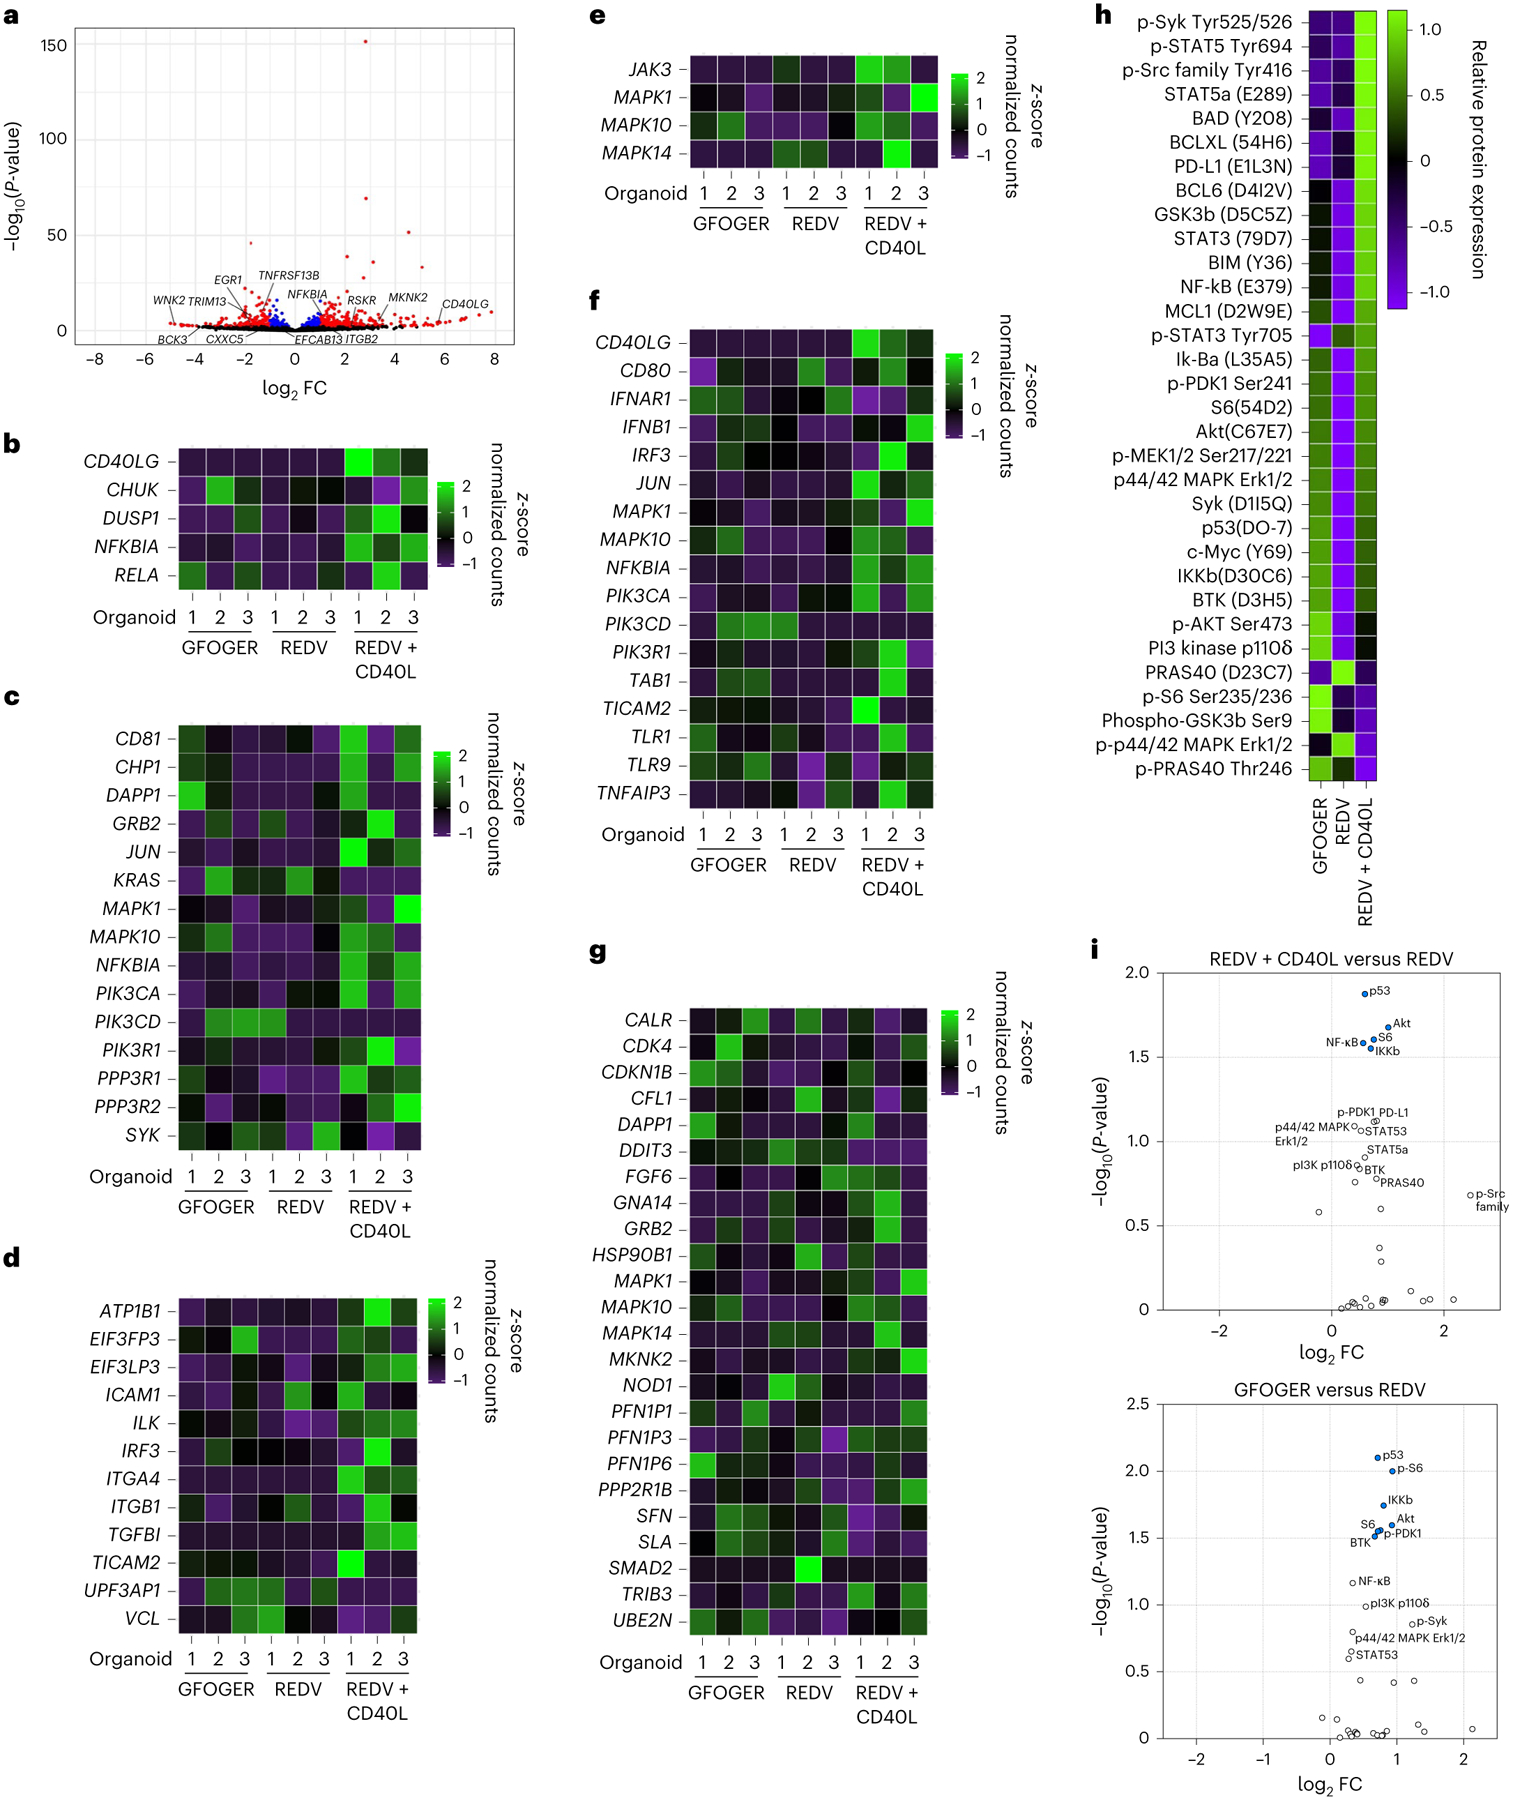
Fig. 4 |. Microenvironment conditions that facilitate MALT1 inhibitor resistance enhance multiple signalling pathways.

a, Volcano plot of statistical significance versus FC for genes from cells cultured in REDV-functionalized organoids with or without CD40L-stromal cells. Differential expressions with P < 0.05 are highlighted in blue and those with P < 0.05 and |log2 FC > 1| are shown in red. Results displayed in the volcano plot were calculated using the R package DESeq2 v.1.36.0, with the function DESeq() and the Wald test. No corrections to P-values were performed. b–g, Heatmaps displaying relative gene expression for various pathways CD40 (b), BCR (c), adhesion (d), STAT3 (e), TLR (f) and PI3k/AKT/mTOR (g), and measured by RNA sequencing, comparing HBL1 cells cultured in GFOGER-functionalized organoids, REDV-functionalized organoids or REDV-functionalized organoids with CD40L-stromal cells. Results indicate three replicates, with each replicate including cells pooled from ten hydrogel-based organoids. h, Heatmap displaying relative protein expression measured via NanoString nCounter SPRINT Profiler comparing HBL1 cells cultured in GFOGER-functionalized organoids, REDV-functionalized organoids or REDV-functionalized organoids with CD40L-stromal cells. Results indicate two replicates, with each replicate including at least 60 organoids. i, Volcano plot of statistical significance versus FC for proteins from cells cultured in REDV-functionalized organoids with CD40L-stromal cells (top) or GFOGER-functionalized organoids (bottom) in comparison to REDV-functionalized organoids without CD40L. Results indicate two replicates, with each replicate including at least 60 organoids. Statistical analysis involved NanoString’s Wald test, negative binomial generalized linear model, or log-linear model following the NanoString differential expression algorithm. Differentially expressed proteins with P < 0.05 are highlighted in blue.
