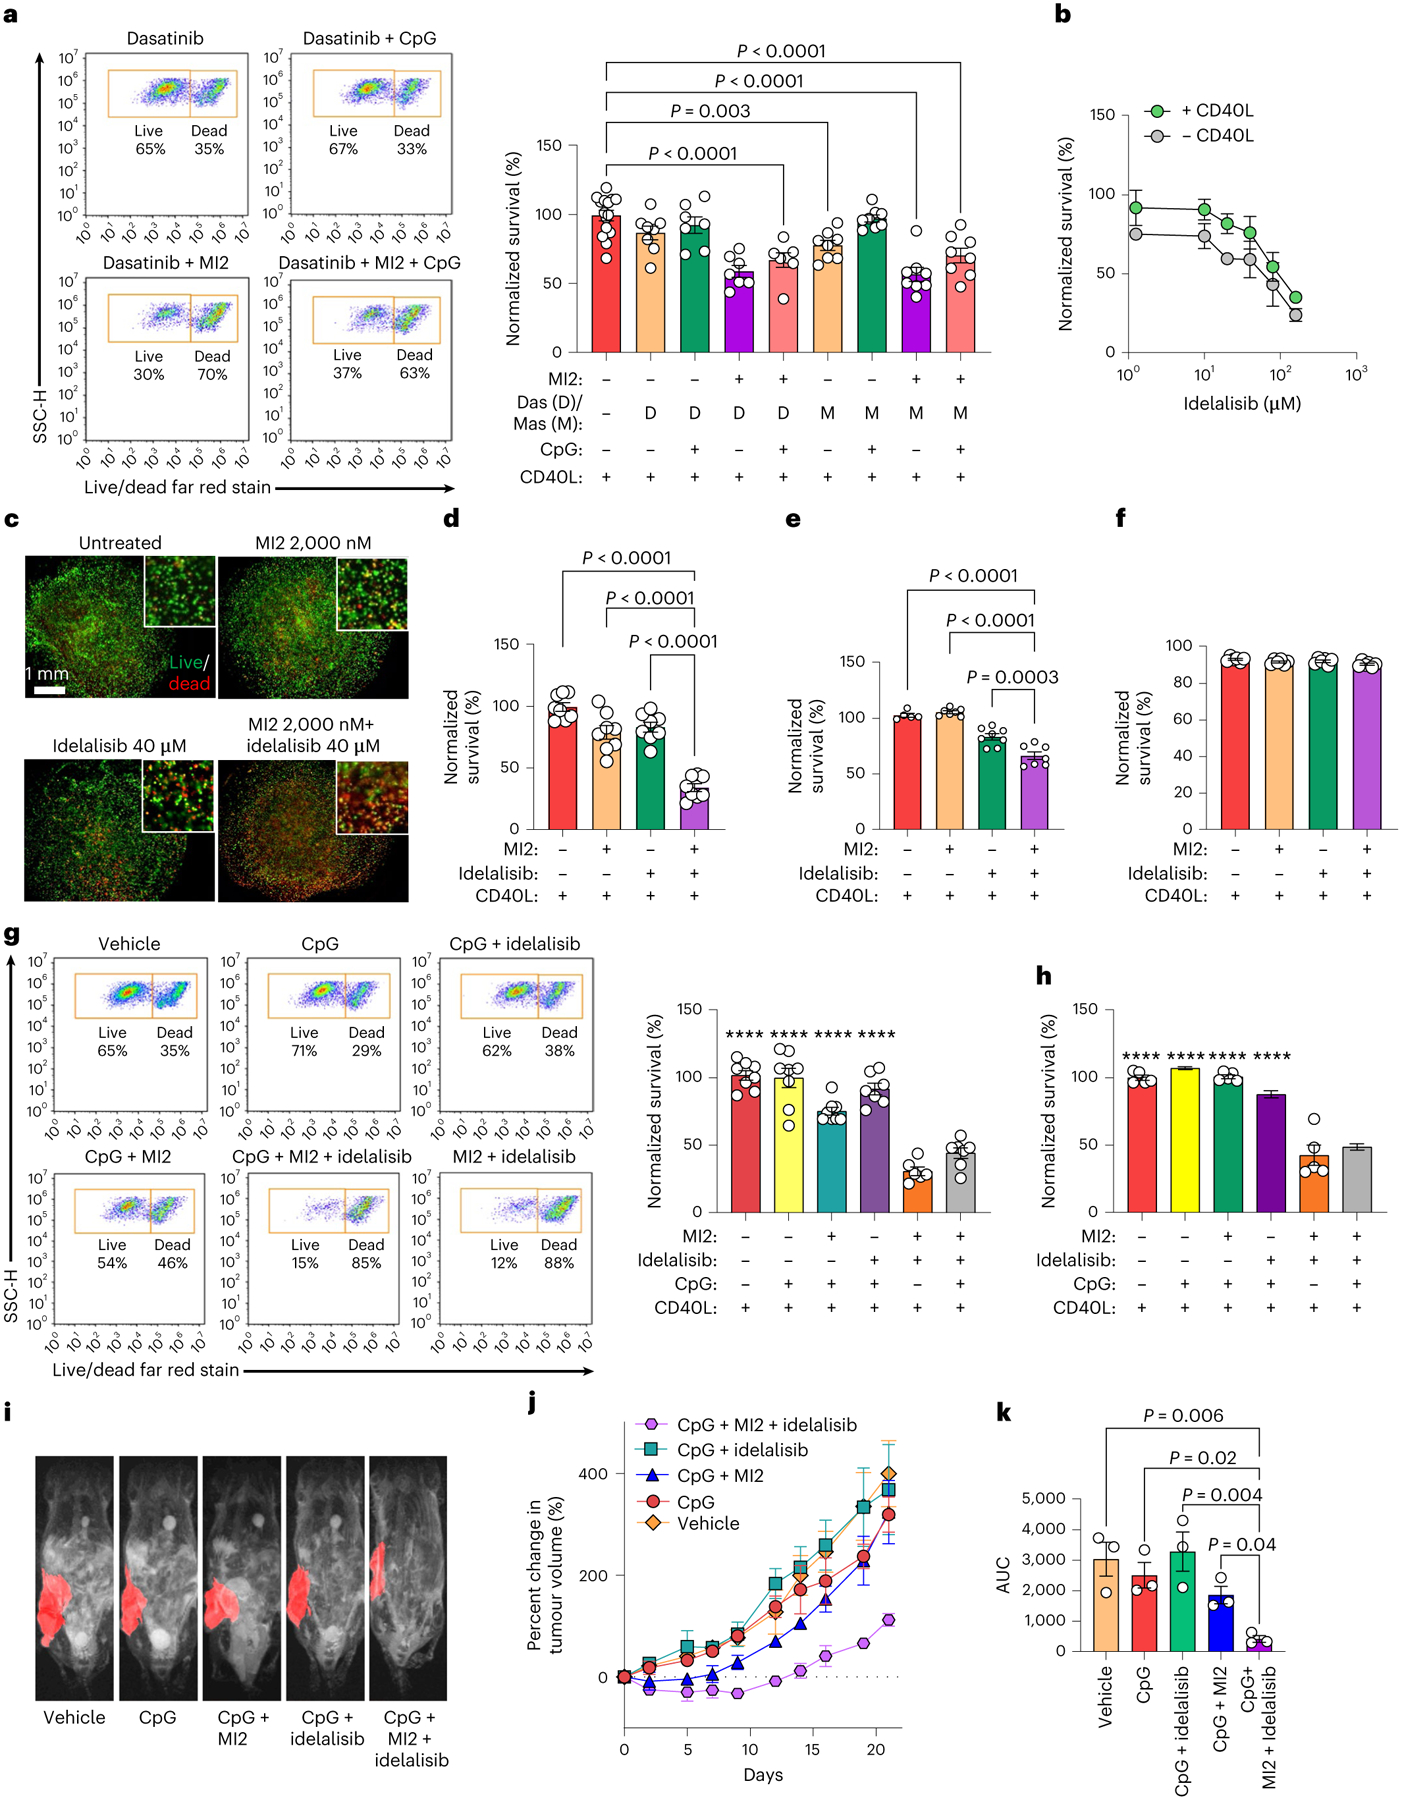
Fig. 6 |. Combinatorial treatment with cooperative signalling pathway inhibitors rescues MALT1 inhibitors in organoids and in vivo.

a, Survival (normalized to vehicle-treated) of HBL1 cells cultured with CD40L-stromal cells for 96 h, treated for 96 h with 1 μM CpG and 48 h with 2,000 nM MI2, 1,600 nM dasatinib (Das) and/or 5,000 nM masitinib (Mas). One-way ANOVA with Dunnett’s multiple-comparison test against vehicle (mean ± s.e.m., n = 7 for dasatinib + MI2, dasatinib + CpG and dasatinib + MI2 + CpG; n = 6 for other treatment groups; n = 15 for vehicle). b, Survival (normalized to vehicle-treated) of HBL1 cells after 48 h of culture in REDV-functionalized organoids and 48 h of treatment with idelalisib (mean ± s.e.m., n = 4). c, Fluorescent images depicting survival of human PDX cells cultured with CD40L-stromal cells for 48 h and subsequent 48 h of indicated treatment (live, calcein, green; dead, ethidium homodimer, red). Images representative of n = 5 organoids. d–f, Survival (normalized to vehicle-treated) of HBL1 cells (d), PDX#4 cells (e) and GCB-DLBCL OCI-LY7 cells (f) cultured with CD40L-stromal cells in REDV-functionalized organoids for 96 h, with 48 h of treatment with vehicle, 2,000 nM MI2, 40 μM idelalisib, or both drugs. One-way ANOVA with Dunnett’s multiple-comparison test against the idelalisib + MI2 group (mean ± s.e.m., PDX: n = 5 for vehicle, n = 7 for MI2, and n = 8 for remaining treatments; n = 8 for HBL1; n = 6 for OCI-LY7). g,h, Survival (normalized to vehicle-treated) for HBL1 cells (g) and human PDX#4 cells (h) cultured with CD40L-stromal cells after 96 h culture in REDV-functionalized organoids with CD40L-stromal cells, where ± indicate 48 h 2,000 nM MI2 treatment or 40 μM idelalisib treatment, and/or 96 h 1 μM CpG treatment. One-way ANOVA with Dunnett’s multiple-comparison test against idelalisib + MI2 group (mean ± s.e.m., ****P < 0.0001 against idelalisib + MI2 group, HBL1: n = 6 for idelalisib + MI2, n = 7 for idelalisib + CpG and idelalisib + CpG + MI2; n = 8 for remaining treatments; n = 5 for PDX). i–k, MRI images depicting implanted human PDXs (i), the percentage change in PDX volumes (j) and the area under the curve (AUC) (k) for treatment groups. Mice were treated daily with 1 mg per kg (body weight) CpG intratumorally and 25 mg per kg (body weight) MI2 and/or 40 mg per kg (body weight) idelalisib intraperitoneally. Results indicate representative MRI or the mean ± s.e.m. of n = 3. One-way ANOVA with Holm–Šídák’s multiple-comparison test.
