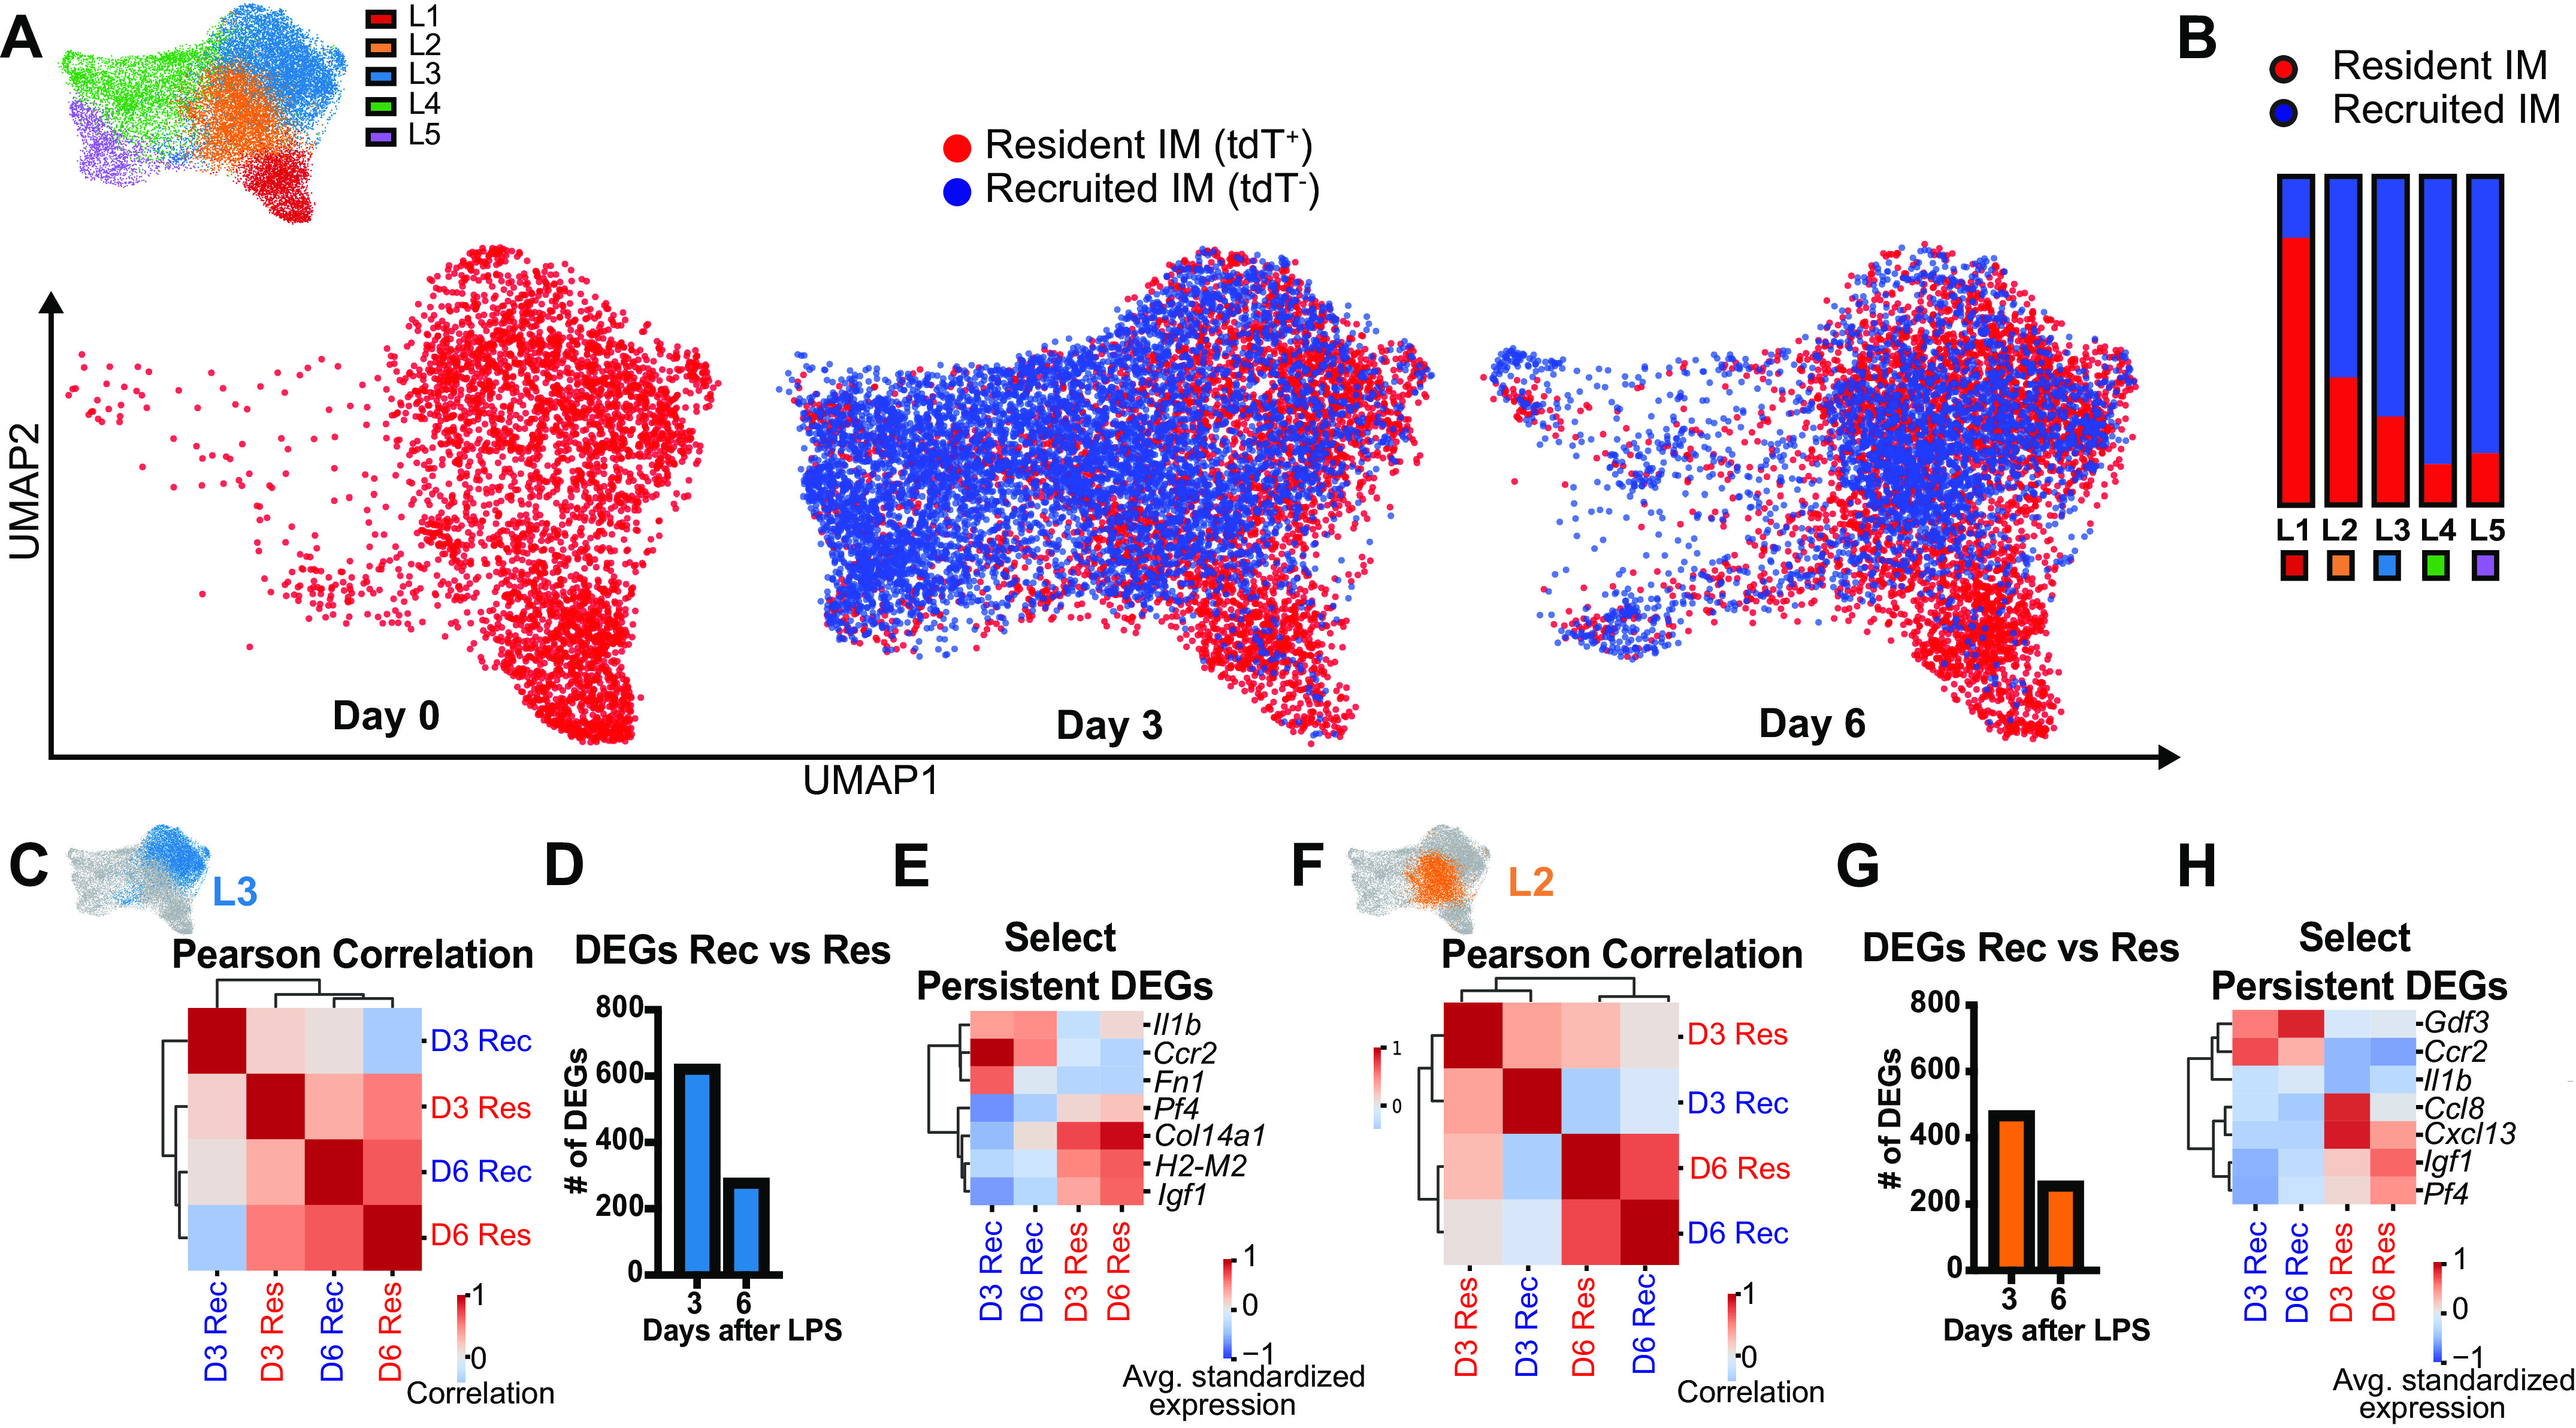
Figure 7.

Time and cell origin determine IM clustering after LPS-induced lung inflammation. A: UMAP plot of IMs showing resident vs. recruited origin at each time point. B: proportion of resident vs. recruited IMs by cluster. C and D: within cluster L3, increasing correlation between recruited and resident IMs over time by Pearson’s correlation (C), and number of significant DEGs (D). E: select DEGs in cluster L3 that remain segregated by cell origin at day 6. F and G: within cluster L2, increasing correlation between recruited and resident IMs over time by Pearson’s correlation (F), and number of significant DEGs (G). H: select DEGs in cluster L2 that remain segregated by cell origin at day 6. DEG, differential expressed gene; IM, interstitial macrophage; LPS, lipopolysaccharide; UMAP, Uniform Manifold Approximation and Projection.
