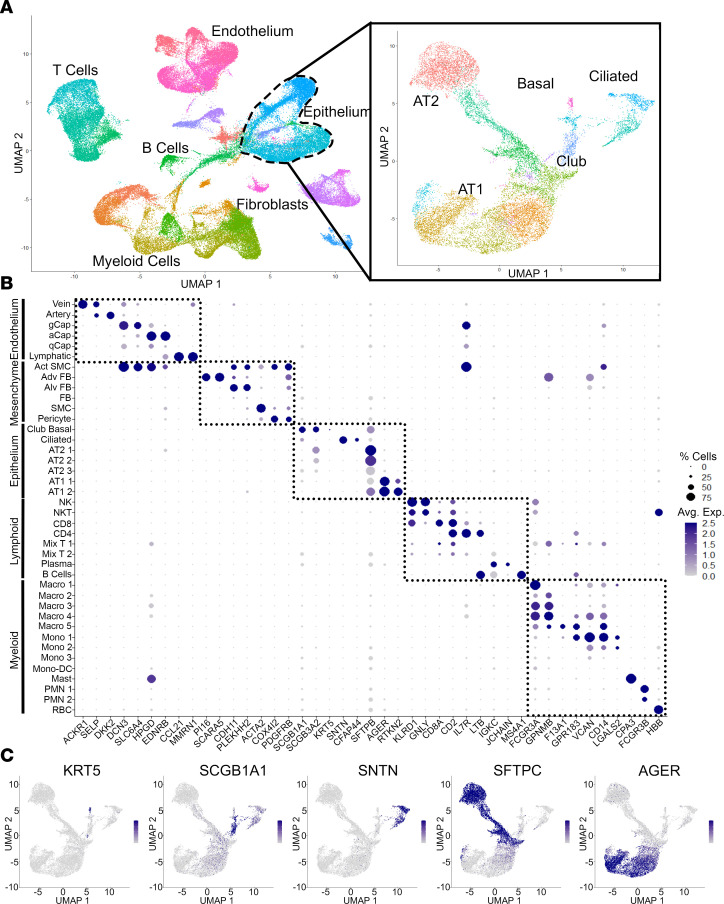
Figure 1. Single-cell RNA-Seq of whole-lung tissue in CLAD.
(A) UMAP representation of cell clusters from combined 7 samples with epithelial subset analysis showing distinct epithelial cell subpopulations. (B) Gene expression dot plot showing unique expression patterns to define 40 lung cell populations in A. Complete annotations with cell counts are provided in Supplemental Data File 1. (C) Gene expression feature plot showing expression of canonical epithelial cell markers used to define epithelial cell clusters in A.

