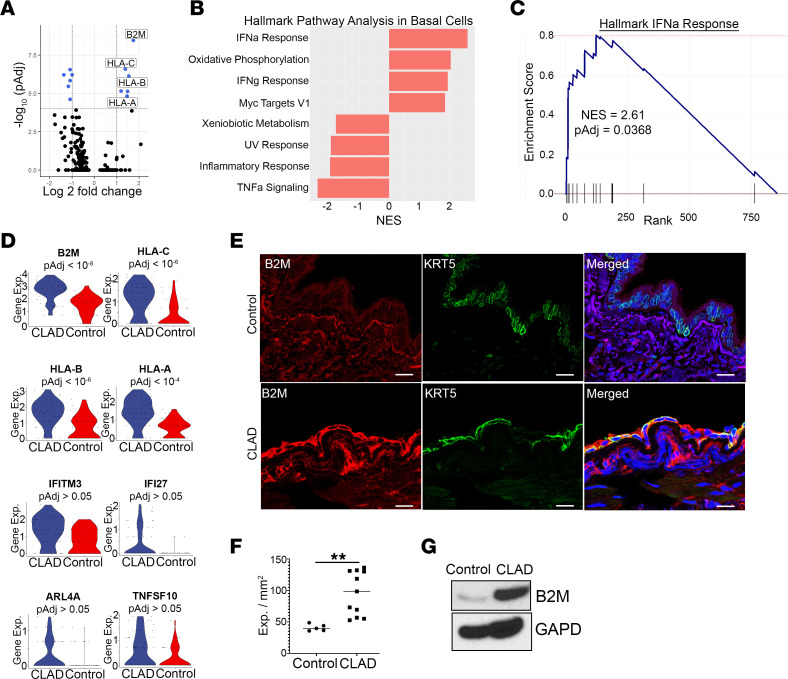
Figure 2. Transcriptional targets of IFN response, including MHC-I expression, are upregulated in CLAD basal cells compared with donor controls.
(A) Volcano plot of gene expression changes in CLAD (n = 4) compared with control (n = 3) basal cells showing upregulation of MHC-I–expressing genes. (B) Hallmark pathway analysis of 855 preranked genes (Supplemental Data File 2) showing pathways significantly different (Padj < 0.05) in CLAD compared with control basal cells. (C) GSEA plot showing enrichment of IFN-α and IFN-γ response genes in CLAD basal cells. (D) Violin plots demonstrating upregulation of IFN response genes in CLAD compared with control basal cells. (E) Immunofluorescence staining of control (top) and CLAD (bottom) airways showing increased expression of MHC-I (red), as measured by antibody staining of B2M, in KRT5+ basal cells (green) from CLAD airway tissue compared with control. Yellow in merged panel shows colocalization of MHC-I expression present in CLAD but not donor controls. Scale bar: 30 μm. (F) Quantification of MHC-I expression in basal cells in every airway across 3 CLAD and 3 control samples. (G) Immunoblotting showing increased protein expression of B2M in epithelial-enriched protein lysates from CLAD compared with control airway tissue. Differential gene expression (A–D) was performed using the Wilcoxon rank sum test with Bonferroni correction to generate adjusted P values. Statistical analysis for protein quantification (F) was performed using the unpaired parametric t test. Data are shown as mean ± SEM. **P < 0.01.

