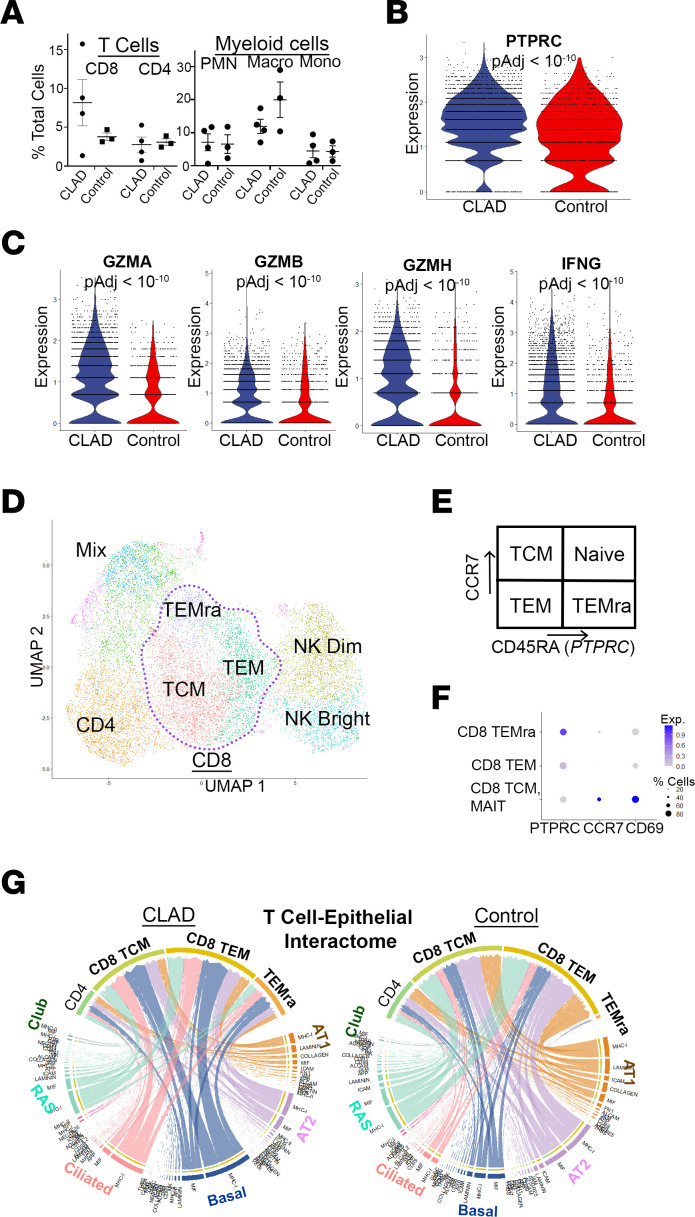
Figure 4. Enrichment of activated and mature cytotoxic CD8+ T cells in CLAD lung compared with donor control.
(A) Cell count analysis of single-cell RNA-Seq data set shows enrichment of total CD8 cell populations (no statistically significant difference). (B) Violin plot of PTPRC (CD45RA) gene expression shows increased maturation of CD8+ T cells in CLAD lung. (C) Violin plots demonstrating increased expression of activation markers (GZMA, GZMB, GZMH, IFNG) in CLAD CD8+ T cells compared with donor control. (D) Subcluster analysis of the T cell population from the single-cell RNA-Seq data set. (E) Schematic of markers (PTPRC, CCR7) of T cell maturation. (F) Gene expression dot plot used to annotate subclusters identified in D. (G) CellChat analysis of predicted T cell–epithelial cell interactions in CLAD (left) compared with control (right) lung cells. The chord diagram shows a predicted increase in CD8+ cell, and especially CD8+ TEMRA cell, interactions with basal and ciliated airway epithelial cells. Statistical analysis for cell counts (A) was performed using unpaired parametric t tests. Differential gene expression (B and C) was performed using the Wilcoxon rank sum test with Bonferroni correction to generate adjusted P values. Data are shown as mean ± SEM.

