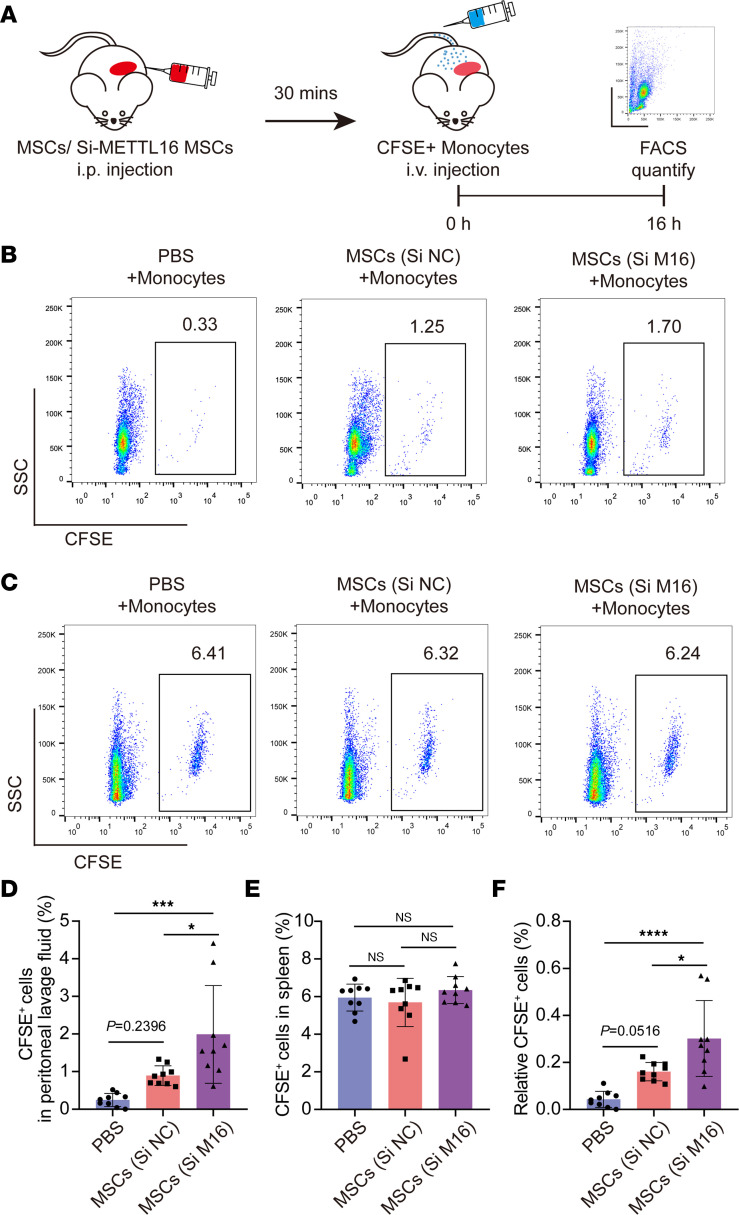
Figure 6. Inhibiting METTL16 expression in MSCs strengthens their monocyte recruitment capacity in vivo.
(A) Schematic representation of the in vivo monocyte migration assay. (B) Representative flow cytometry histograms of CFSE-labeled monocytes in peritoneal lavage fluids of NOD/SCID mice. (C) Representative flow cytometry histograms of CFSE-labeled monocytes in the spleens of NOD/SCID mice. (D) Flow cytometry analysis of the percentage of CFSE-positive monocytes in peritoneal lavage fluids (n = 9). (E) Flow cytometry analysis of the percentage of CFSE-positive monocytes in the spleen (n = 9). (F) Relative CFSE-positive monocytes in peritoneal lavage fluids normalized to CFSE-positive cells in spleen (n = 9). Data are presented as the mean ± SD. One-way ANOVA followed by Bonferroni’s test was performed in D–F. *P < 0.05; ***P <0.001; ****P < 0.0001. NS, not significant; MSCs, mesenchymal stem cells.

