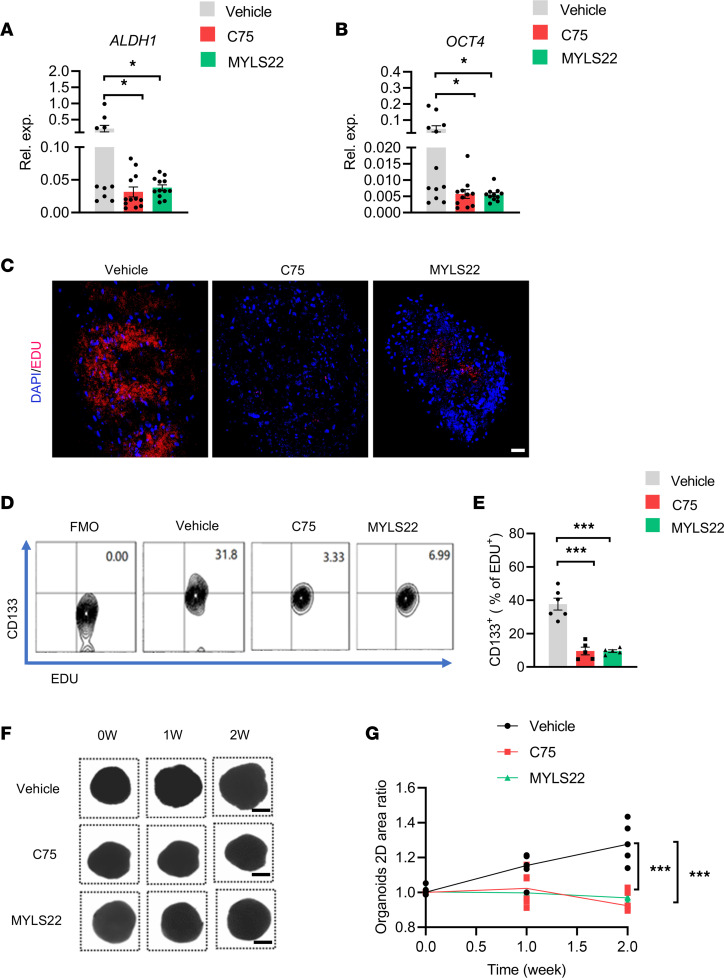
Figure 12. Targeting lipogenesis and mitochondrial fusion restrict CSCs in PDOs.
(A and B) PDOs were treated with or without C75 (50 μM) and MYLS22 (40 μM) for 7 days and tested for mRNA expression of CSC-related genes ALDH1 plus OCT4. Mean ± SEM from 12 PDOs in each group. (C) PDOs were treated with or without C75 (50 μM) and MYLS22 (40 μM) for 7 days and monitored for EdU+ proliferating tumor cells. Nuclei were stained with DAPI. A representative from 6 PDOs in each group. Scale bar: 20 μm. (D and E) PDOs were treated with or without C75 (50 μM) and MYLS22 (40 μM) for 7 days and monitored for CD133+ cells within EdU+ proliferating cells. Representative and mean ± SEM from 6 independent experiments. (F and G) PDOs were treated with C75 (50 μM) and MYLS22 (40 μM) for the indicated time and analyzed for organoid growth by measuring 2D areas. Shown are sample bright-field images of individual PDOs. Scale bars: 500 mm. Data from 5 PDOs in each group. *P < 0.05, ***P < 0.001 with ANOVA and Tukey’s method.

