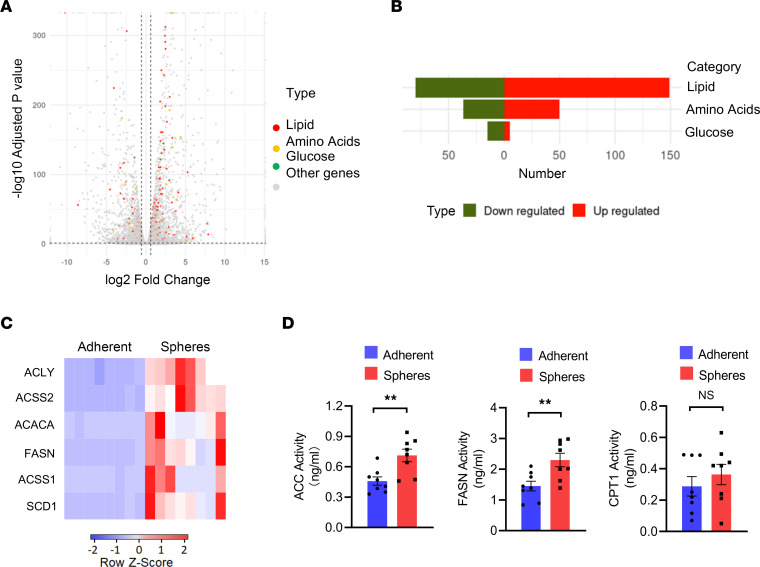
Figure 4. Elevated expression and activities of lipogenic enzymes in CSCs.
(A) Volcano plot shows metabolic signatures by quantifying glucose (green), lipid (red), and amino acids (yellow) metabolic-related genes that are differentially expressed in A549 tumor spheres compared with adherent cells. RNA-Seq from 3 samples in each group. (B) Histogram showing the number of changed genes that are related to glucose, lipid, and amino acids metabolism in A549 tumor spheres and adherent cells. RNA-Seq from 3 samples in each group. (C) mRNA expressions of the indicated lipogenesis-related genes in A549 tumor spheres and adherent cells. Shown from 8 independent experiments. (D) The enzymic activities of ACC, FASN, and CPT1 in A549 tumor spheres and adherent cells. Mean ± SEM from 8 independent experiments. **P < 0.01 with paired t test.

