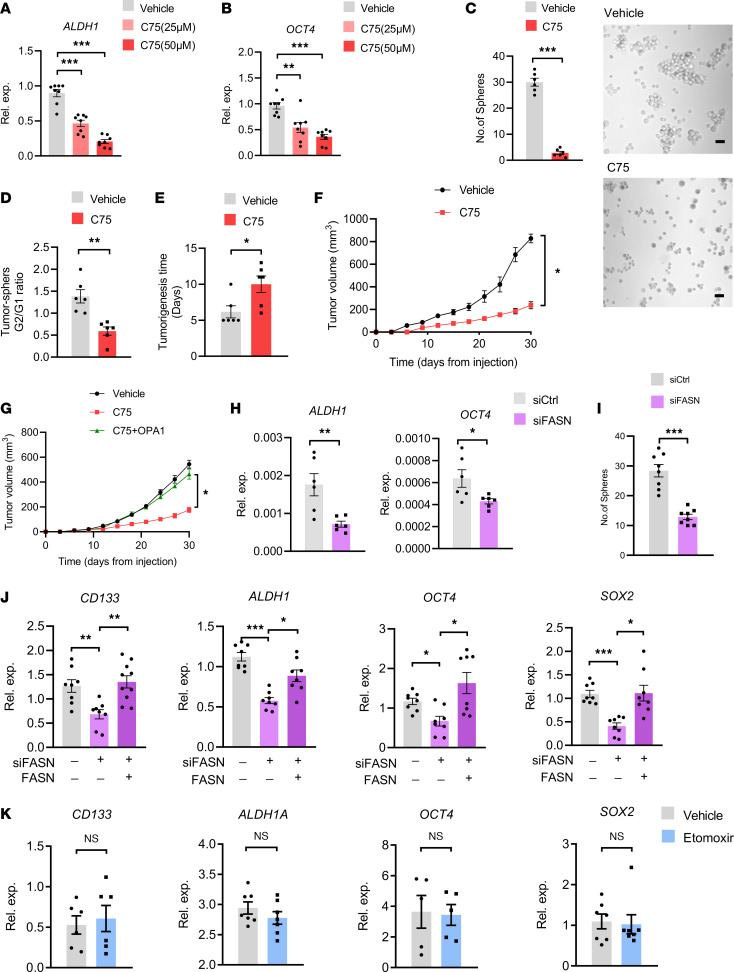
Figure 7. Lipogenesis controls the stem-like properties of CSCs.
(A and B) A549 tumor spheres were treated with an increasing dose of C75 and detected for ALDH1 and OCT4 expressions by qPCR after 12 hours. Mean ± SEM from 8 independent experiments. (C) A549 tumor spheres with or without C75 treatment (50 μM) were analyzed for sphere formations. Representative and mean ± SEM from 5 independent experiments. Scale bar: 10 μm. (D) Ration of A549 tumor sphere formation for the first (G1) and second (G2) generations after C75 (50 μM) treatment. Mean ± SEM from 5 independent experiments. (E and F) A549 tumor spheres with or without C75 treatment (50 μM) were analyzed for tumor initiation and growth in NSG mice. Mean ± SEM from 6 mice in each group. (G) A549 tumor spheres with or without C75 treatment (50 μM) plus OPA1 overexpression were analyzed for tumor growth in NSG mice. Mean ± SEM from 6 mice in each group. (H) A549 tumor spheres with or without FASN knockdown were detected for ALDH1 and OCT4 mRNA by qPCR. Mean ± SEM from 6 independent experiments. (I) Knockdown of FASN in A549 tumor spheres inhibited sphere-formations. Mean ± SEM from 8 independent experiments. (J) A549 tumor spheres were transfected using a second FASN siRNA with or without the reintroduction of FASN and were analyzed for expression of the stem-related genes. Mean ± SEM from 8 independent experiments. (K) A549 tumor spheres were treated with or without CPT1 inhibitor Etomoxir (100 μM) and analyzed for expression of the stem-related genes. Mean ± SEM from 5–7 independent experiments. *P < 0.05, **P < 0.01, ***P < 0.001 with ANOVA plus Tukey’s method (A, B, and J) and paired t test (C–I and K).

