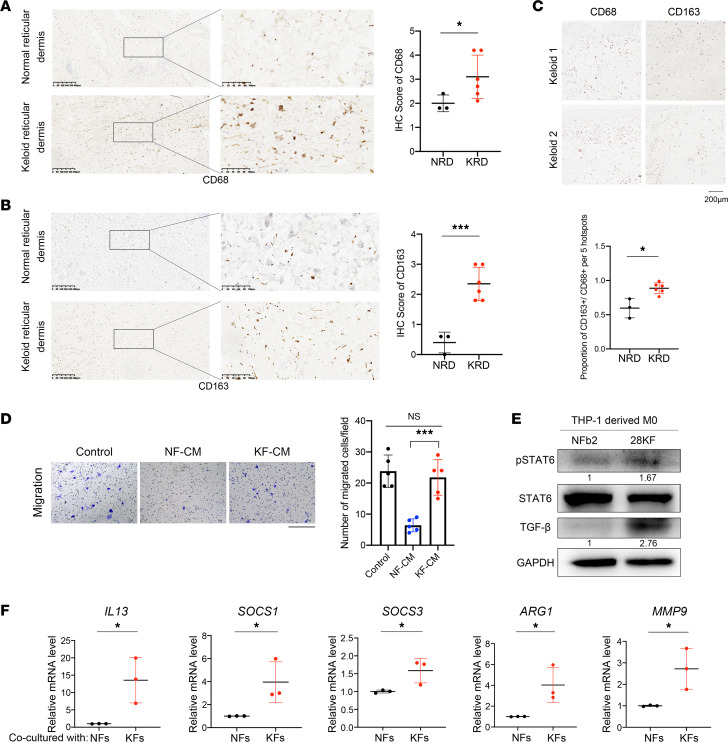
Figure 1. M2-like macrophages were enriched in keloids.
(A) Representative images of IHC staining of CD68 (macrophages) in normal skin and keloid. Scale bars: 200 μm. Quantification by IHC scores shown on right. (B) Representative images of IHC staining of CD163 (M2-like macrophages) in normal skin and keloid. Scale bar: 200 μm. Quantification by IHC scores shown on right. (C) Representative images of IHC staining of CD68 and CD163 in the same samples. Scale bar: 50 μm. The ratio of CD163+/CD68+ representing percentage of M2-like/total macrophages was quantified by positive cell number/nuclei number (blue) per 5 hotspots and is shown below. (D) Transwell migration assay of PMA-induced THP-1 (M0) cells upon stimulation with NF-CM and KF-CM. Scale bar: 400 μm. Quantification of chemoattracted cells shown on right. (E) Expression of p-STAT6, STAT6, and TGF-β in THP-1–derived M0 cells when cocultured with indicated fibroblasts. Relative gray scale of p-STAT6/STAT6 and TGF-β/GAPDH are shown below the blots. (F) The mRNA levels of indicated genes in THP-1–derived M0 cells in different coculture systems (n = 3). *P < 0.05; ***P < 0.001 by 2-tailed Student’s t test. NS, not significant (P > 0.05).

