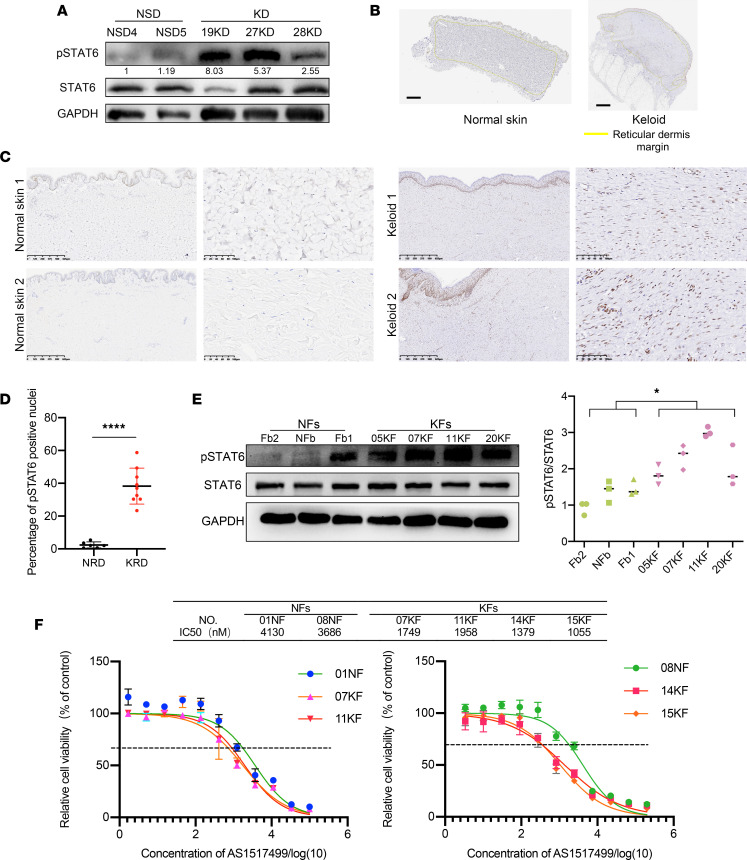
Figure 2. JAK/STAT6 signaling was activated in KFs.
(A) Expression of p-STAT6 and STAT6 in normal skin dermis (NSD) and keloid dermis (KD) (n = 2 and 3, respectively). (B) HALO analysis of reticular dermis (circled in yellow lines) of normal skins (n = 6) and keloids (n = 9). Quantification of percentage of p-STAT6+ nuclei shown on right. (C and D) Representative images and quantification of p-STAT6 IHC staining of normal skins and keloids. Scale bars: 100 μm. (E) Expression of p-STAT6 and STAT6 in NFs (n = 3) and KFs (n = 4). Quantification of p-STAT6/STAT6 by relative gray value shown below. (F) Sensitivity of NFs and KFs to p-STAT6 inhibitor AS1517499. Cell proliferation was detected by CCK8 assay (n = 2 and 4, respectively). Error bars represent SD. Experiments were performed 3 times and in triplicate each time. *P < 0.05; ****P < 0.0001 by 2-tailed Student’s t test.

