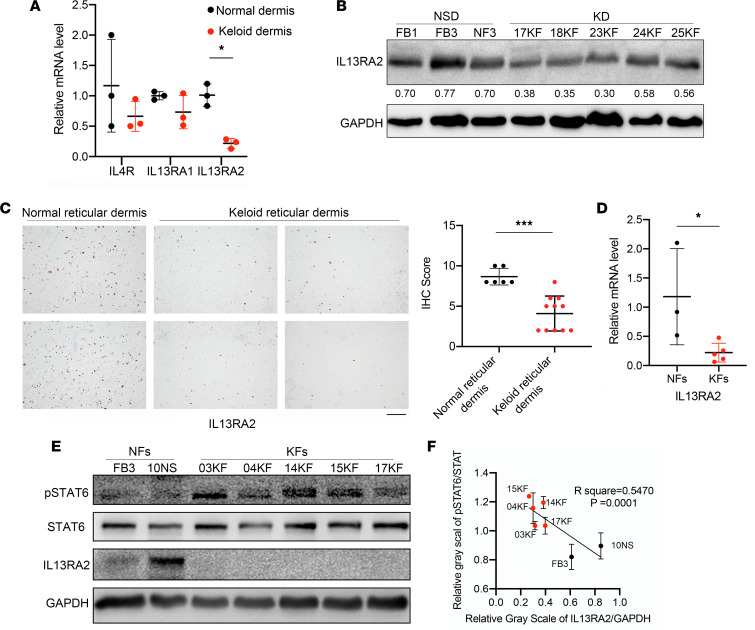
Figure 3. IL-13RA2 was downregulated in KFs and negatively correlated with p-STAT6.
(A) The mRNA levels of IL13RA2, IL13RA1, and IL4R in normal skin dermis and keloids (n = 3 and 5, respectively). (B) The protein level of IL-13RA2 in normal skin dermis (NSD) and keloid dermis (KD). Quantification of gray scale of IL-13RA2/GAPDH is shown below. (C) Representative images of IL-13RA2 expression by IHC staining in normal skins and keloids. Scale bar: 50 μm. IHC scores of IL-13RA2 in normal skin (n = 6) and keloids (n = 11) is shown on right. (D) The mRNA level of IL13RA2 in NFs and KFs (n = 3 and 5, respectively). (E) The protein level of IL-13RA2 in NFs (n = 3) and KFs (n = 4). (F) The negative correlation between IL-13RA2 and p-STAT6. Pearson’s correlation analysis of relative gray values is shown. Error bars represent SD. Experiments were performed 3 times. *P < 0.05; ***P < 0.001 by 2-tailed Student’s t test.

