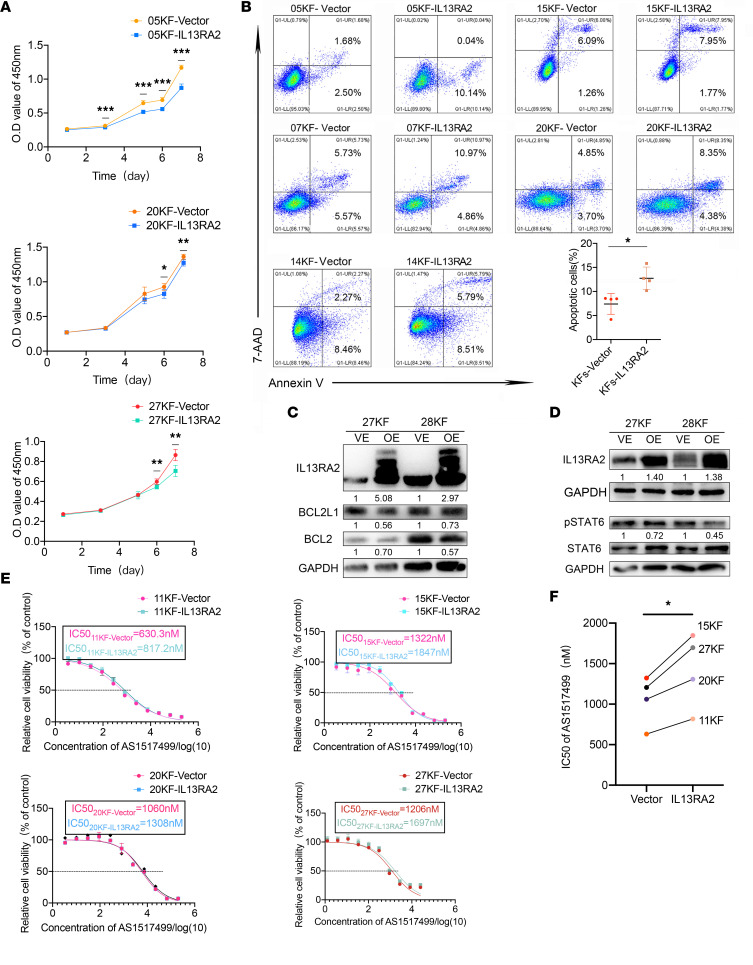
Figure 4. Overexpression of IL-13RA2 induced KF apoptosis.
(A) Growth curves of KFs upon IL-13RA2 overexpression. (B) Annexin V/7-AAD double staining assay of KF-vector and KF-IL13RA2 cells (n = 5). Quantification of Annexin V–positive rates, representing apoptotic rates, is shown below. (C and D) Expression of p-STAT6, BCL2L1, and BCL2 in KFs upon IL-13RA2 overexpression. Quantifications of relative gray scale is shown below the blots. (E and F) IC50 values of AS1517499 in KF-vector and KF-IL13RA2 cells. *P < 0.05; **P < 0.01; ***P < 0.001 by paired, 2-tailed Student’s t test.

