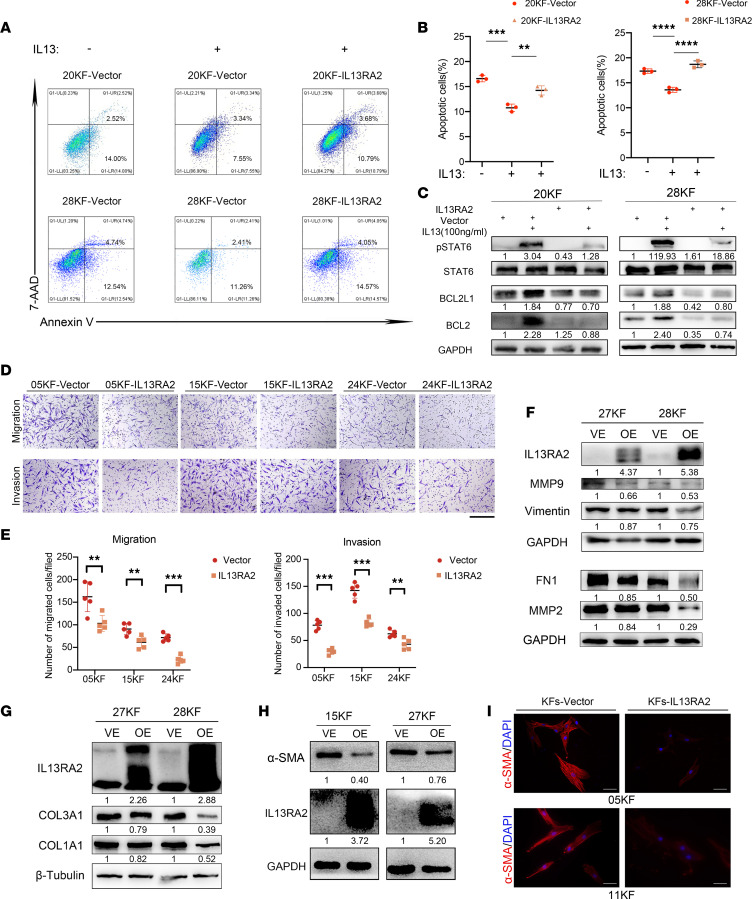
Figure 5. Overexpression of IL-13RA2 alleviated KF IL-13–related profibrotic cell behavior.
(A) Annexin V/7-AAD double staining assay of KFs with or without IL-13 stimulation. (B) Quantification of Annexin V–positive rates, representing apoptotic rates. (C) Expression of p-STAT6, BCL2L1, and BCL2 in 20KF-vector and 20KF-IL13RA2 cells with or without IL-13 stimulation. (D and E) Migration and invasion of KF-vector and KF-IL13RA2 cells. Scale bar: 50 μm. Quantification of migrated and invaded cells is shown in E. (F and G) Expression of MMPs, COL3A1 and COL1A1, and mesenchymal markers FN1 and vimentin in KF-vector and KF-IL13RA2 cells. (H) Expression of α-SMA in KF-vector and KF-IL13RA2 cells. (I) Representative images of α-SMA immunofluorescent staining in KF-vector and KF-IL13RA2 cells. Scale bars: 100 μm. Error bars represent SD. Experiments were performed 3 times and at least in triplicate each time. **P < 0.01; ***P < 0.001; ****P < 0.0001 by 2-tailed Student’s t test.

