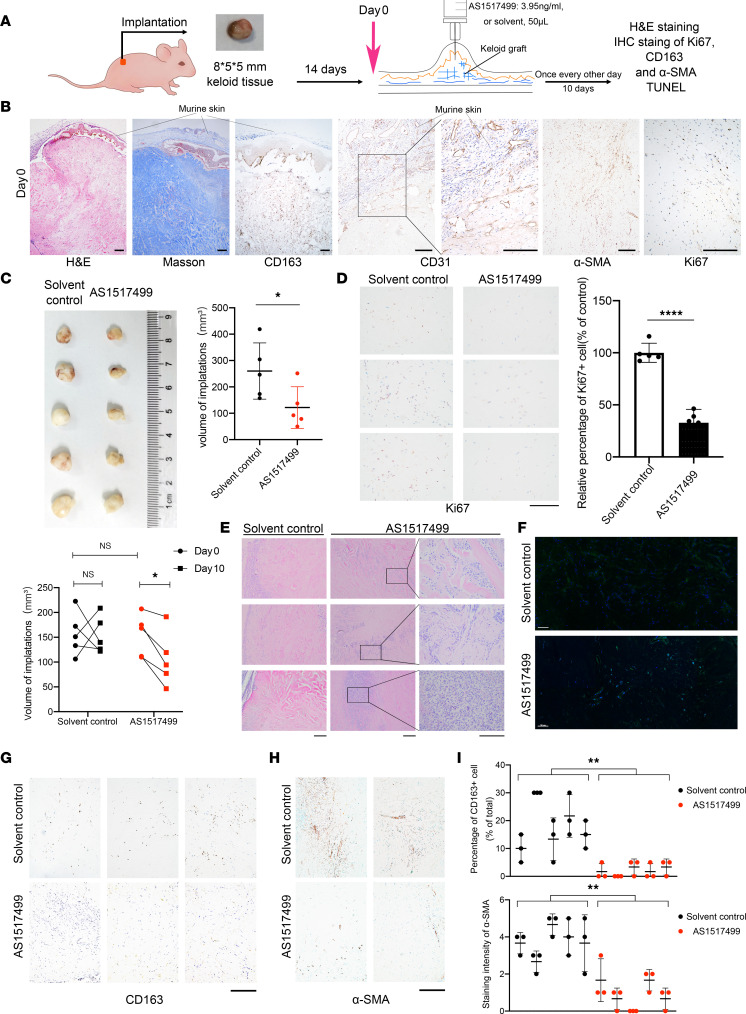
Figure 8. AS1517499 inhibited fibrosis in keloid implantation model.
(A) Schematic diagram of animal experiment. (B) Representative images of H&E, Masson’s trichrome, and IHC staining for CD163, CD31, α-SMA, and Ki67 on day 0. Scale bars: 50 μm. (C) Images of transplantations after 10-day treatments. Quantification of volumes of xenografts in AS1517499-treated and control group is shown on the right (after dissection) and below (in vivo). (D) Representative images of IHC staining of Ki67 in AS1517499-treated and control group. Quantification of the percentage of Ki67+ cells is shown on the right. Scale bar: 100 μm. (E) Representative images of H&E staining of xenograft tissues in AS1517499-treated and control group. Scale bars: 50 μm. (F) Representative images of whole-slide scan of TUNEL staining in AS1517499-treated and control group. Cell nuclei were stained with DAPI (blue), and TUNEL-positive nuclei are stained in green. Scale bars: 100 μm. (G and H) Representative IHC staining of CD163 and α-SMA in AS1517499-treated and control group. Scale bars: 50 μm. (I) Quantification of percentage of CD163+ and α-SMA staining intensity. Error bars represent SD. *P < 0.05; **P < 0.01; ****P < 0.0001 by 2-tailed Student’s t test. NS, not significant (P > 0.05).

