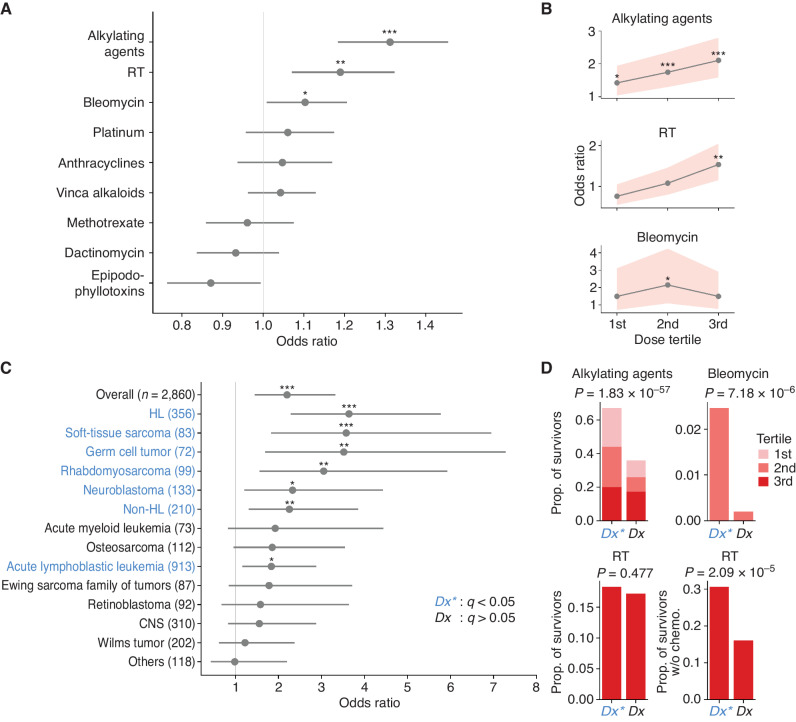
Figure 2.
Associations of CH prevalence with clinical variables. A, Odds ratios and 95% CIs for CH and cancer therapies. Multivariable logistic analysis adjusted for other therapy doses, age at blood sampling, and age at diagnosis. Cumulative doses were used for chemotherapy. For RT, maximum region-specific dose was used after adjusting for the active bone marrow distribution at the diagnosis age. Variables were scaled by standard deviation. Bars represent 95% CIs. *, P < 0.05; **, P < 0.01; ***, P < 0.001. B, Odds ratio between significant therapies in A and CH over the dose tertile. Odds ratios were similarly adjusted as in A. Bands represent 95% CIs. *, P < 0.05; **, P < 0.01; ***, P < 0.001. C, Age-adjusted odds ratios of CH relative to the control were estimated for diagnoses with 50 survivors or more. Uncommon diagnoses with <50 cases were combined as “Others.” Diagnoses in blue indicate a significant odds ratio and are collectively denoted as Dx*. Bars represent 95% CIs. *, q (Benjamini–Hochberg corrected P) < 0.05; **, q < 0.01; ***, q < 0.001. D, Comparison of therapy intensity in CH-associated cancer types (Dx*, blue) with those not associated with CH (Dx, black). The frequency of therapy intensities found significant in B was compared between the two groups by proportion test. The analysis on the bottom right was restricted to survivors who had not received chemotherapy.

