. 2023 Feb 8;13(4):844–857. doi: 10.1158/2159-8290.CD-22-0956

Figure 3.

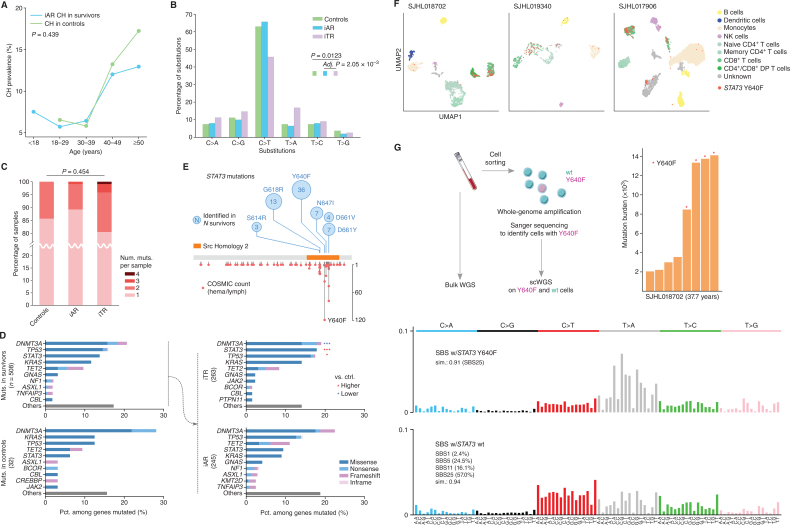
Figure 3. Molecular features of inferred age- versus therapy-related CH. A, Comparable prevalence of inferred age-related (iAR) CH in the survivors (blue) and CH in the controls (green). Fisher exact test showed no significant difference between the two groups (P = 0.439). B, Mutation spectra of SNVs in the control (green), iAR (blue), and iTR (purple). Spectrum frequency was compared by the χ2 test followed by post hoc χ2. Only significant comparisons are shown. Post hoc P value was adjusted by the Šidák method. C, Distribution of mutation count per sample. The distribution in each group was compared by the Kruskal–Wallis test. D, CH mutation frequency in the top 10 genes identified in the survivors and controls. The CH mutations in survivors were further stratified into iAR and iTR groups, and the top 5 genes were compared with the control by a two-sided proportion test. *, q (Benjamini–Hochberg corrected P) < 0.05 and ***, q < 0.001 with red indicating a proportion higher than control, and blue if lower. E, STAT3 mutations identified in this study (top, number in the circle represents occurrence) and the COSMIC (v97) for hematologic and lymphoid tumors (bottom, y-axis shown occurrence). F, Cell phenotype and STAT3 Y640F genotype in blood samples from three survivors profiled by Mission Bio's Tapestri assay on single-cell amplicon-based DNA and protein sequencing. Cells were mapped by uniform manifold approximation and projection (UMAP) by protein antibody data and colored by their corresponding cell types. Those harboring Y640F mutation are labeled in red. G, Mutation burden and signature analysis for SJHL018702 by single-cell whole-genome sequencing (scWGS). The peripheral blood sample was sorted for viable cells followed by multiple displacement amplification (MDA) to generate scWGS data in STAT3 Y640F-mutant and wild-type cells (left). Mutation burden by somatic SNVs identified from scWGS using bulk WGS as a control is shown as bar plot with Y640F-mutant cells marked by a red star (middle). Mutational signatures of Y640F-mutant cells and wild-type cells are shown at the right.

Molecular features of inferred age- versus therapy-related CH. A, Comparable prevalence of iAR CH in the survivors (blue) and CH in the controls (green). Fisher exact test showed no significant difference between the two groups (P = 0.439). B, Mutation spectra of single-nucleotide variants (SNV) in the control (green), iAR (blue), and iTR (purple). Spectrum frequency was compared by the χ2 test followed by post hoc χ2. Only significant comparisons are shown. Post hoc P value was adjusted by the Šidák method. C, Distribution of mutation count per sample. The distribution in each group was compared by the Kruskal–Wallis test. D, CH mutation frequency in the top 10 genes identified in the survivors and controls. The CH mutations in survivors were further stratified into iAR and iTR groups, and the top five genes were compared with the control by a two-sided proportion test. *, q (Benjamini–Hochberg corrected P) < 0.05 and ***, q < 0.001, with red indicating a proportion higher than control and blue if lower. E,STAT3 mutations identified in this study (top, number in the circle represents occurrence) and the COSMIC database (v97) for hematologic and lymphoid tumors (bottom, y-axis shows occurrence). F, Cell phenotype and STAT3 Y640F genotype in blood samples from three survivors profiled by Mission Bio's Tapestri assay on single-cell amplicon-based DNA and protein sequencing. Cells were mapped by uniform manifold approximation and projection (UMAP) by protein antibody data and colored by their corresponding cell types. Those harboring Y640F mutation are labeled in red. DP, double-positive; NK, natural killer. G, Mutation burden and signature analysis for SJHL018702 by scWGS. The peripheral blood sample was sorted for viable cells followed by multiple displacement amplification to generate scWGS data in STAT3 Y640F–mutant and wild-type (wt) cells (left). Mutation burden by somatic SNVs identified from scWGS using bulk WGS as a control is shown as a bar plot with Y640F-mutant cells marked by a red star (right). Mutational signatures of Y640F-mutant cells and wt cells are shown at the bottom.