. 2023 Jan 18;11(4):405–420. doi: 10.1158/2326-6066.CIR-22-0462

Figure 3.

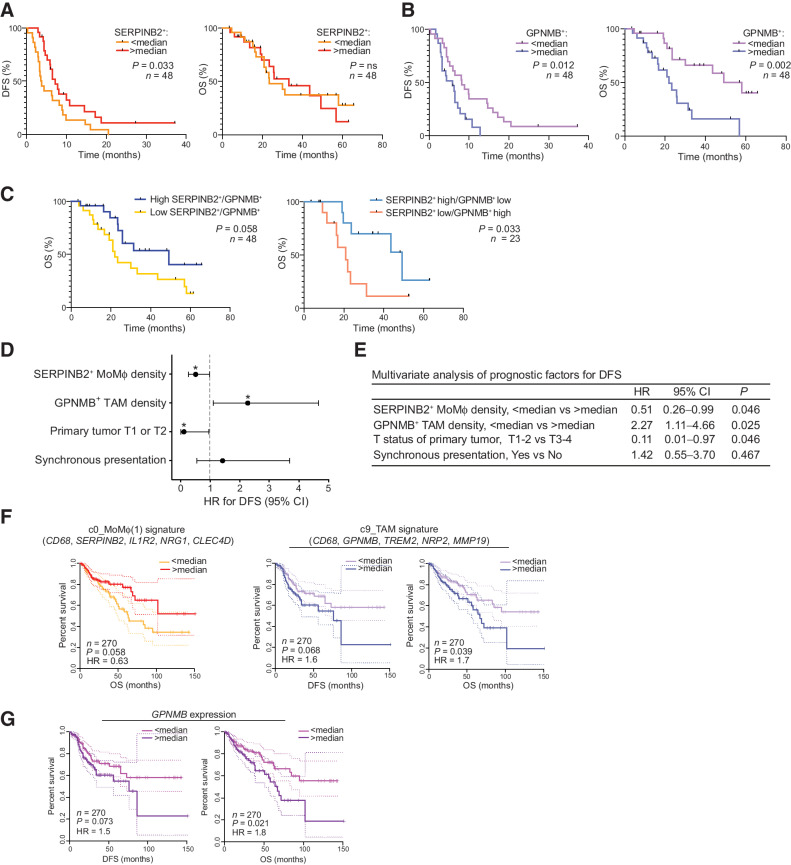
Figure 3. Clinical relevance of SERPINB2+ MoMϕ and GPNMB+ TAMs in CLM and primary CRC. Association of SERPINB2+ MoMϕ and GPNMB+ TAMs with clinical outcome in a restrospective CLM cohort by mf-IHC and survival analysis of a TCGA colon cancer dataset. A, Kaplan–Meier curve showing DFS (left; P = 0.033 by log-rank Mantel–Cox test) and OS (right; P = not significant by log-rank Mantel–Cox test), according to SERPINB2+ cell density. n = 48. B, Kaplan–Meier curve showing DFS (left; P = 0.012 by log-rank Mantel–Cox test) and OS (right; P = 0.002 by log-rank Mantel–Cox test), according to GPNMB+CD68+ cell density. n = 48. C, Kaplan–Meier curve showing OS according to GPNMB+SERPINB2+ ratio (left; P = 0.058 by log-rank Mantel–Cox test; n = 48) and OS according to GPNMB+SERPINB2+ score (right; P = 0.033 by log-rank Mantel–Cox test; n = 23). D, Forest plot showing the results of multivariate regression analysis for DFS. Reference line of HR for recurrence (dashed line), HRs (circles), and 95% CI (whiskers) are shown. *, P < 0.05. E, Table showing Cox multivariate regression analysis of prognostic factors for DFS. F, DFS and OS curves on TCGA colon cancer (TCGA-COAD; n = 270) dataset based on median expression of gene signatures from c0_MoMϕ(1) and c9_TAM. Dotted lines show 95% CI. P value by log-rank Mantel–Cox test. G, DFS and OS curves on TCGA colon cancer (TCGA-COAD; n = 270) dataset based on median expression of GPNMB. Dotted lines show 95% CI. P value by log-rank Mantel–Cox test.

Clinical relevance of SERPINB2+ MoMϕ and GPNMB+ TAMs in CLM and primary CRC. Association of SERPINB2+ MoMϕ and GPNMB+ TAMs with clinical outcome in a restrospective CLM cohort by mf-IHC and survival analysis of a TCGA colon cancer dataset. A, Kaplan–Meier curve showing DFS (left; P = 0.033 by log-rank Mantel–Cox test) and OS (right; P = not significant by log-rank Mantel–Cox test), according to SERPINB2+ cell density. n = 48. B, Kaplan–Meier curve showing DFS (left; P = 0.012 by log-rank Mantel–Cox test) and OS (right; P = 0.002 by log-rank Mantel–Cox test), according to GPNMB+CD68+ cell density. n = 48. C, Kaplan–Meier curve showing OS according to GPNMB+SERPINB2+ ratio (left; P = 0.058 by log-rank Mantel–Cox test; n = 48) and OS according to GPNMB+SERPINB2+ score (right; P = 0.033 by log-rank Mantel–Cox test; n = 23). D, Forest plot showing the results of multivariate regression analysis for DFS. Reference line of HR for recurrence (dashed line), HRs (circles), and 95% CI (whiskers) are shown. *, P < 0.05. E, Table showing Cox multivariate regression analysis of prognostic factors for DFS. F, DFS and OS curves on TCGA colon cancer (TCGA-COAD; n = 270) dataset based on median expression of gene signatures from c0_MoMϕ(1) and c9_TAM. Dotted lines show 95% CI. P value by log-rank Mantel–Cox test. G, DFS and OS curves on TCGA colon cancer (TCGA-COAD; n = 270) dataset based on median expression of GPNMB. Dotted lines show 95% CI. P value by log-rank Mantel–Cox test.