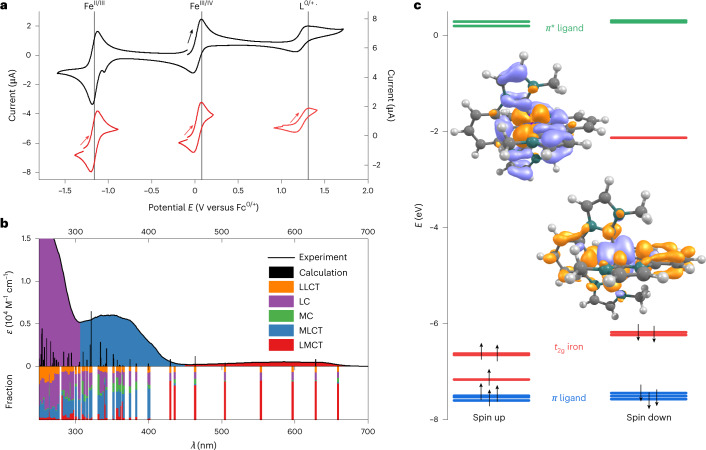
Fig. 2. Electrochemical, optical and electronic properties of 1.
a, Cyclic voltammogram of 1 (10−3 M) in MeCN with 0.1 M [nBu4N][PF6] as the electrolyte at a scan rate of 100 mV s−1. Left y axis, whole voltammogram; right y axis, individual voltammograms. b, Ultraviolet–visible spectrum of 1 in MeCN (10−4 M) with TDDFT-calculated transitions and contributions from ligand-to-ligand charge-transfer (LLCT), ligand-centred π–π* (LC), metal-centred (MC), LMCT and MLCT states. c, Molecular orbital scheme showing the highest occupied orbitals (t 2g orbitals (red) and ligand-based orbitals (blue)) and the lowest unoccupied orbitals (π* orbitals of the ligand moiety (green)). The transition densities of the dominant LMCT (left) and MLCT (right) transitions are also depicted (hole, purple; electron, orange).

