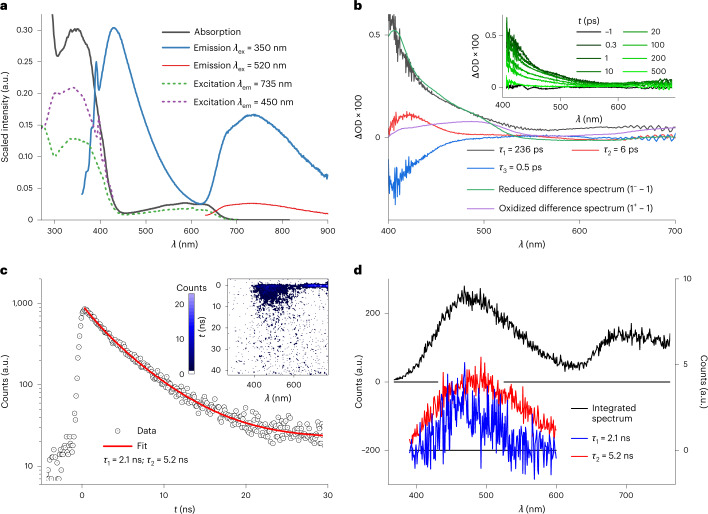
Fig. 3. Excited-state spectroscopy and characterization of 1.
a, Absorption and emission spectra of 1 at λ ex = 350 and 520 nm. The excitation spectra measured at 735 and 450 nm are shown as dashed lines. b, DAAS with τ 1 = 236 ps, τ 2 = 6.1 ps and τ 3 = 0.5 ps, obtained from femtosecond transient absorption data after excitation at 330 nm and compared with the reduction and oxidation difference spectra obtained from spectroelectrochemical measurements as rough models for LMCT and MLCT excited states neglecting the radical cation and radical anion character of the ligands in these excited states. Inset, transient absorption spectra at the given delay times. ΔOD, change in the optical density. c, Decay of the fluorescence between 390 and 600 nm obtained from SCMs (inset) of a degassed solution of 1 in MeCN after 330 nm excitation, showing a double exponential decay with time constants of 2.1 ns (27.3%) and 5.2 ns (72.7%). d, Time-integrated spectrum obtained from SCMs with λ ex = 330 nm (left y axis), showing a close resemblance with the fluorescence spectrum and the amplitude spectra of the 2.1 and 5.2 ns components (right y axis).

