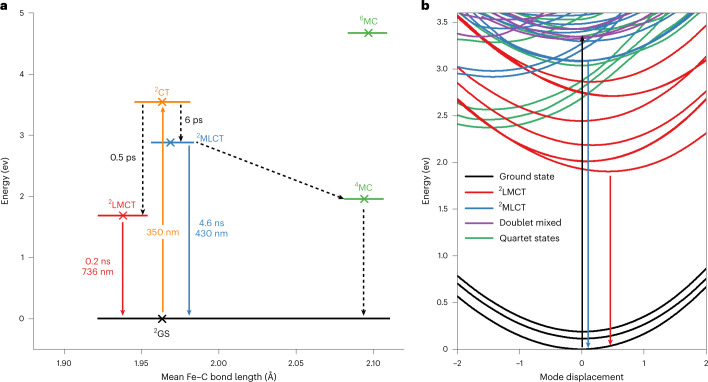
Fig. 4. Summary of deactivation pathways and associated time scales of 1.
a, Jablonski diagram based on the experimental results and calculated ground-state DFT energies of the optimized doublet, quartet and sextet states in their respective geometries (crosses). The 2LMCT and 2MLCT geometries are approximated from the calculated geometries of 1 − and 1 +. The orange arrow indicates the excitation at 350 nm, the dotted arrows indicate non-radiative transitions, the blue arrow indicates the MLCT emission and the red arrow indicates the LMCT emission. GS, ground state; CT, charge transfer; MC, metal centred. b, TDDFT potential energy curves for displacement along with the a1 symmetry vibrational mode (in D2d symmetry), showing doublet LMCT, MLCT and mixed LMCT/ligand-centred states, as well as quartet metal-centred states. The black arrow indicates the excitation at 350 nm, the blue arrow indicates the MLCT emission and the red arrow indicates the LMCT emission.

