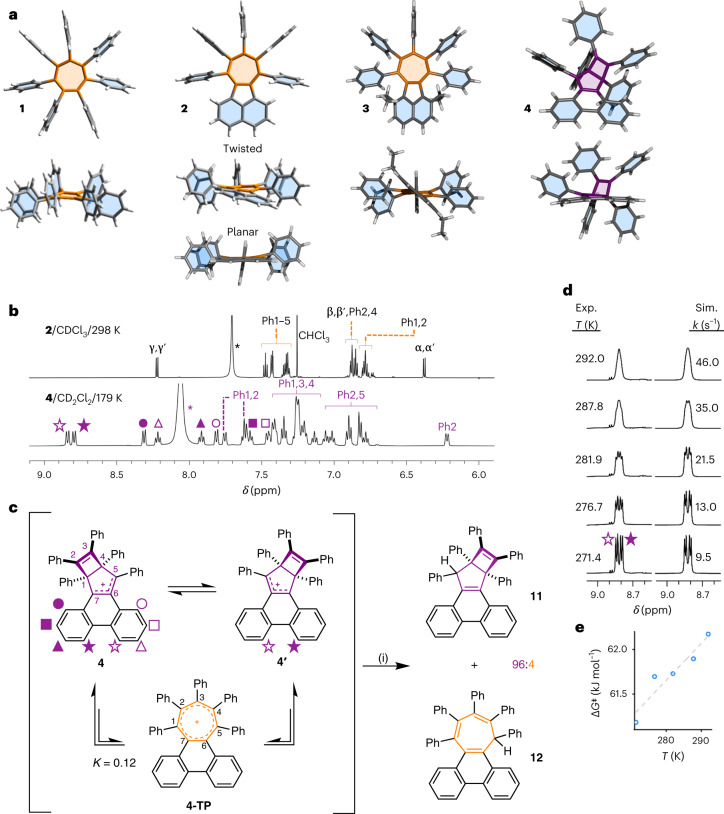
Fig. 4. Highly twisted tropyliums are found to undergo a non-aromatic-to-aromatic equilibrium.
a–e, Single-crystal XRD analysis and NMR spectroscopy show the increasingly twisted geometries of 1–3 and the preferred Dewar tropylium structure of 4, which is in equilibrium with 4-TP. a, Plan and side views of single-crystal X-ray structures of cations 1–4. Counterions and solvent molecules have been omitted for clarity. Both of the conformers present in the unit cell of 2 are shown in side view. b, Partial 1H NMR spectra of 2·SbCl6 (top, 700 MHz) and 4·SbCl6 (bottom, 500 MHz). Full spectra are shown in Supplementary Figs. 26 and 32, respectively. The peaks of 2 are labelled according to the numbering scheme shown in Fig. 2. Asterisks denote signals corresponding to R2OH+ (R = H or Et), formed as a byproduct from the reaction of the Et3O+ reagent. Filled and hollow shape symbols represent pairs of inequivalent resonances that arise by breaking the tropylium C2 symmetry upon forming the Dewar tropylium. c, The dynamic exchange between two degenerate Dewar tropylium isomers of 4 and its tropylium form was intercepted by reduction to give 11 and 12 in a ratio of 96:4. Reagents and conditions: (i) NaBH4, THF, rt, 30 min. d, This dynamic rearrangement causes broadening of NMR resonance lineshapes as the temperature is raised from 271.4 to 292.0 K. Full NMR spectra are shown in Supplementary Fig. 41. The rate data were obtained by comparing the experimental (Exp.) and simulated (Sim.) lineshapes. e, Fitting the rate data to the Eyring equation gives an Eyring plot of ΔG‡ versus T for the exchange. The linear fit (dashed grey line) indicates ΔH‡ = 50.0 kJ mol−1 and ΔS‡ = −41.5 J K−1 mol−1.

