Figure 1.
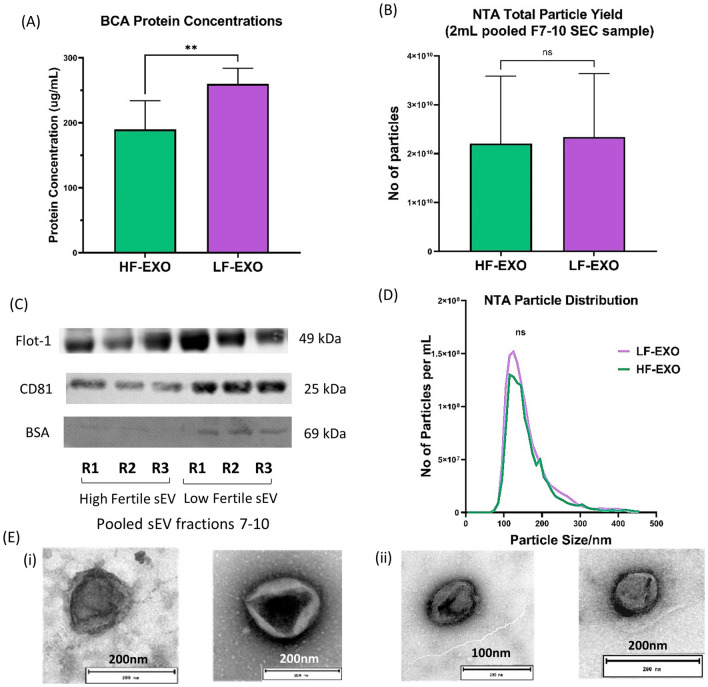
Blood plasma sEV from high fertile and low-fertile both confirmed sEV characteristics and differ in total protein concentrations. (A) Total protein content of sEV from low fertile dairy cow plasma are significantly higher than the high fertile. Values are presented as mean ± SD (**P < 0.001; Mann–Whitney test). (B) However, there’s no significant difference between the particle number (yield) according to the nano-particle tracking analysis (NTA) results. Values are presented as mean ± SD (**P < 0.001; Mann–Whitney test). (C) Representation of western blot sEV/exosome marker CD81, FLOT-1 and negative sEV/exosome marker BSA for pooled sEV fractions 7–10 of HF-EXO and LF-EX. Presence of FLOT-1 and CD81 and less abundance of BSA confirmed sEV/exosome. The full western blot images are available in the Supplementary File 3 (D) The size of sEV (nm) is within the defined size (30–200 nm)—average nano-particle tracking analysis (NTA) particle size distribution of HF-EXO and LF-Exo biological replicates (n = 10 each). There was no statistically significant difference between HF-EXO and LF-EXO particle size distributions (ns represents P > 0.05; Mann–Whitney test). (E) Spherical shape was confirmed in electron micrographs of exosomes from both (i) HF-EXO and (ii) LF-EXO.

