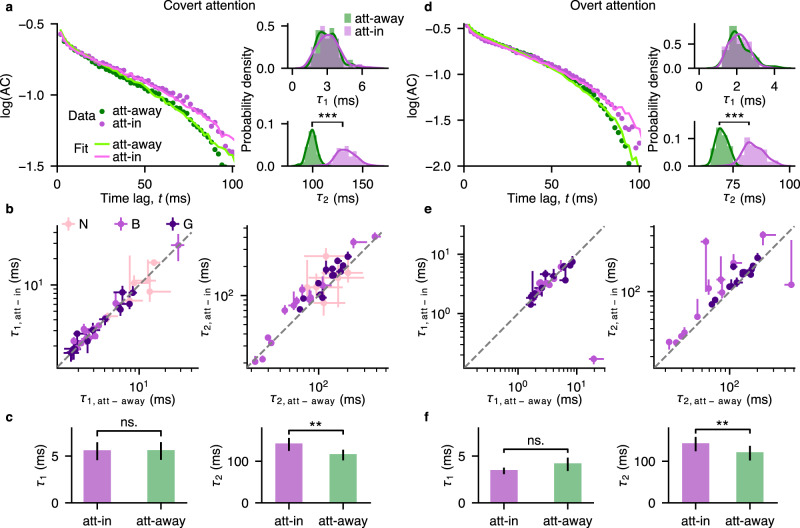
Fig. 3. Slow timescales increase during spatial attention.
a Autocorrelations (ACs) of neural data with two-timescale fits (left) and the corresponding posterior distributions (right) during covert attention and attend-away condition for an example recording session. The fitted lines are autocorrelations of synthetic data from the two-timescale model with MAP parameters. The posterior distribution of the slow timescale (τ2) has significantly larger values in attend-in (att-in) than in attend-away (att-away) condition. Statistics: two-sided Wilcoxon rank-sum test, , . Number of samples in each posterior N = 100. b The increase of the slow timescale (τ2, right) during attention was visible on most sessions (points - MAP estimates for individual sessions, error bars - the first and third quartiles of the marginal posterior distribution, dashed line - the unity line). If the MAP estimate was smaller than the first or larger than the third quartile, the error bar was discarded. Larger error bars indicate wider posteriors, i.e. larger estimation uncertainty. Number of included sessions (in which autocorrelations were better fitted with M2) from the total fitted sessions for each monkey: NG = 13/19, NB = 13/13, NN = 6/12. Color of the dots indicates different monkeys. c Across sessions, the fast timescale (τ1, left) did not change, while the slow timescale (τ2, right) significantly increased during covert attention (magenta) relative to the attend-away condition (green). Bar plots show the mean ± s.e.m of MAP estimates across sessions. Statistics: two-sided Wilcoxon signed-rank test, , . ns., **, *** indicate p > 0.05/4, p < 10−2, p < 10−3, respectively (Bonferroni corrected for 4 comparisons). Individual data points are shown in b. d–f Same as a–c but during the overt attention for a different example session. Number of included sessions from the total fitted sessions for each monkey: NG = 14/19, NB = 12/12. Statistics: d , , (f) , . Source data are provided as a Source Data file.

