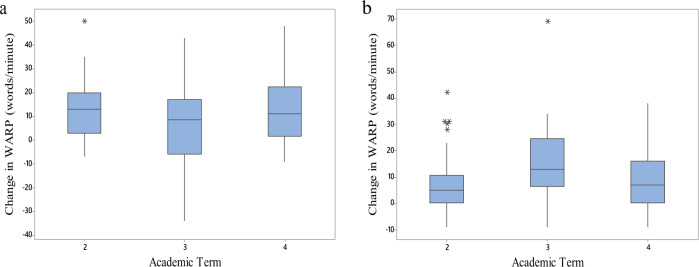
Fig. 2. Change in reading fluency (term-by-term) for schools following each condition sequence.
Panel (a) shows classes following the Enclosed/Open/Enclosed sequence and Panel (b) shows classes following the Open/Enclosed/Open sequence. The centre line of each boxplot represents the data median and the bounds of the box show the interquartile range. The whiskers represent the bottom 25% and top 25% of the data range—excluding outliers which are represented by an asterisk.

