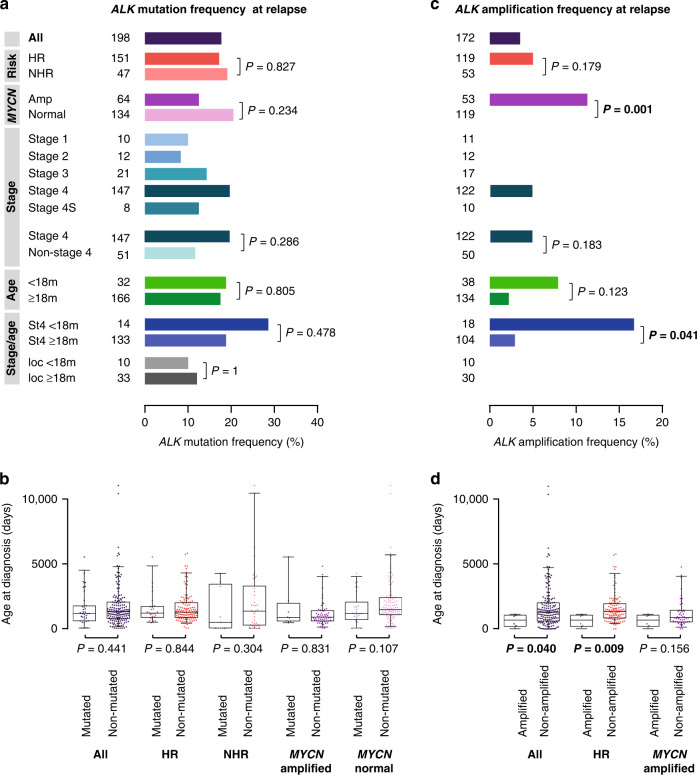
Fig. 3. ALK alterations in neuroblastoma at relapse.
a ALK mutation frequencies in relapsed neuroblastoma. b Age at diagnosis of patients with ALK-mutated versus non-mutated relapsed neuroblastoma. c ALK amplification frequencies in relapsed neuroblastoma. d Age at diagnosis of patients with ALK-amplified versus non-amplified relapsed neuroblastoma. Boxplots show the median, first, and third quartile (boxes), with whiskers indicating the minimum and maximum of the data within 1.5× the interquartile range. P values for a and c were calculated using Fisher’s exact test or Chi-squared test where appropriate, and for b and d using Wilcoxon–Mann–Whitney test. HR, high-risk; NHR, non-high-risk; ampl, amplified; m, months; St4, stage 4; loc, localized disease.

