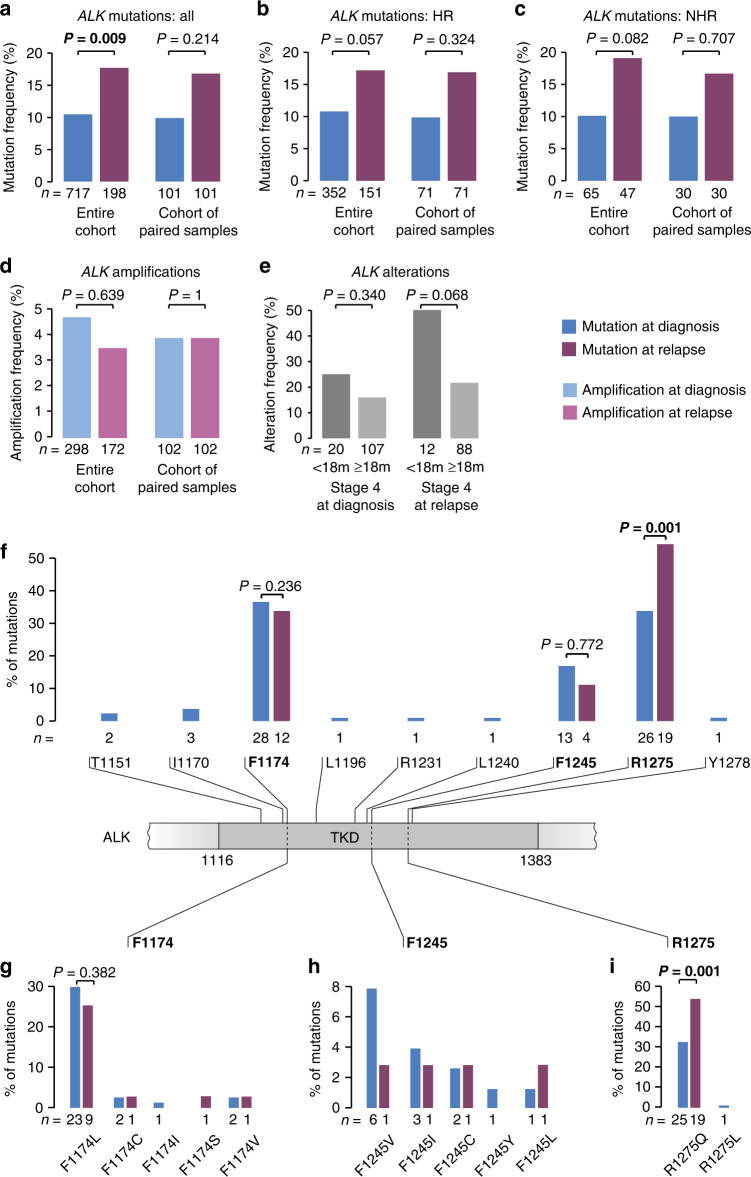
Fig. 4. Comparison of ALK alteration frequencies in neuroblastoma obtained at diagnosis and at relapse.
a ALK mutation frequencies in neuroblastoma obtained at diagnosis versus relapse in the entire cohort (left) and in the subgroup of patients of whom paired samples were available (right). b ALK mutation frequencies in neuroblastoma obtained at diagnosis versus relapse in high-risk tumors (HR) in the entire cohort (left) and in the subgroup of patients of whom paired samples were available (right). c ALK mutation frequencies in neuroblastoma obtained at diagnosis versus relapse in non-high-risk tumors (NHR) in the entire cohort (left) and in the subgroup of patients of whom paired samples were available (right). d ALK amplification frequencies in neuroblastoma obtained at diagnosis versus relapse in the entire cohort (left) and in the subgroup of patients of whom paired samples were available (right). e ALK alteration frequencies in stage 4 neuroblastoma of patients <18 months versus ≥18 months at diagnosis in the cohort of tumors obtained at diagnosis (left) and at relapse (right). f Schematic representation of the ALK tyrosine kinase domain (TKD) and the amino acid positions and frequencies of mutations detected in neuroblastoma samples at diagnosis and at relapse. g Frequencies of mutation types at position F1174 at diagnosis and at relapse. h Frequencies of mutation types at position F1245 at diagnosis and at relapse. i Frequencies of mutation types at position R1275 at diagnosis and at relapse. Of note, mutation type of one mutation detected in a tumor at relapse had remained unknown. P values were calculated using Fisher’s exact test.

