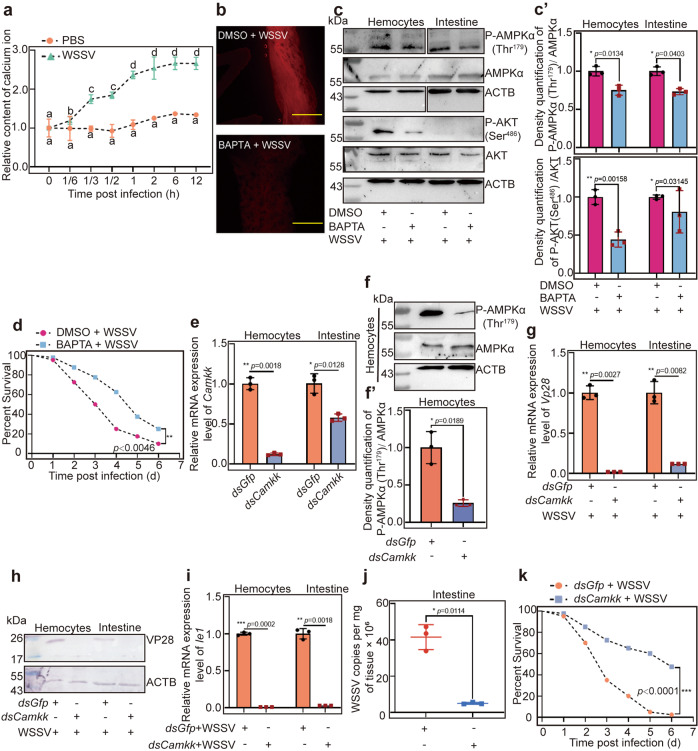
Fig. 4. Ca2+ /CaMKK is responsible for phosphorylation of AMPK in shrimp challenged by WSSV.
a Ca2+ concentration in the intestines of shrimp was detected at 0 (control), 10 min, 20 min, 30 min, 1, 2, 6, and 12 h post WSSV injection using a microplate reader. PBS injection was used as control. b Ca2+ concentration in the intestines of BAPTA-injected shrimp following WSSV infection was analyzed under a fluorescence microscope, DMSO injection following WSSV infection was used as the control group. Scale bar = 500 μm. c Phosphorylation levels of AMPK and AKT in BAPTA-injected shrimp following WSSV infection. Panel c′ is the statistical analysis of panel c based on three replicates. d Survival rate of the BAPTA-injected shrimp challenged by WSSV (n = 40). DMSO injection was used as the control (n = 40). e The efficiency of Camkk interference in hemocytes and intestines, analyzed using qPCR. f Detection of phosphorylated AMPKα (p-AMPKα) in hemocytes of Camkk-RNAi shrimp following WSSV infection, analyzed using western blotting. f′ is the statistical analysis of panel f based on three replicates. g, h VP28 expression at the mRNA (g) and protein (h) levels in hemocytes and intestine of Camkk-knockdown shrimp following WSSV challenge, analyzed using qPCR and western blotting. i, j Ie1 expression (i) and viral copy number (j) of WSSV in the Camkk-knockdown shrimp. k Survival rate of the Camkk-knockdown shrimp challenged by WSSV (n = 40) and dsGfp injection was used as the control (n = 40). Significant differences were analyzed using the log-rank test in GraphPad Prism 8.0 software. All results are shown as means ± SD for experiments repeated at least three times; the data were analyzed statistically using Student’s t test. *P < 0.05; **P < 0.01; ***P < 0.001.

