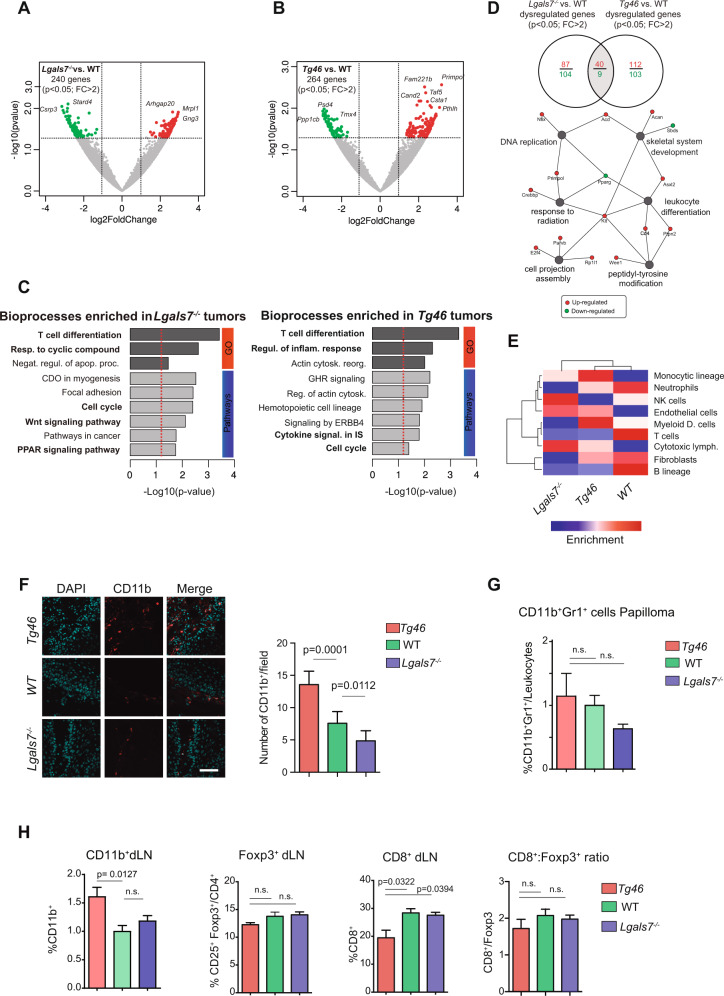
Fig. 3. Enhanced Gal-7 expression shapes the immune landscape in murine skin papillomas.
Volcano-plots from analysis of RNAseq data from Lgals7−/−, Tg46 and WT papillomas, showing 240 and 264 genes differentially expressed in Lgals7−/− (A) and Tg46 (B) lesions, respectively, compared with WT tumors (p < 0.05, FC > 2). C Functional enrichment analysis of RNAseq data. Bioprocesses found enriched in Lgals7−/− (left panel) and Tg46 (right panel) tumors, compared with their WT counterparts, are shown. D Genes found to be dysregulated in Lgals7−/− or Tg46 lesions compared with WT tumors, and network-based pathway enrichment analysis. E Heat map analysis of tumor-infiltrating immune cells. F Analysis of CD11b+ cells in papillomas from Tg46, WT and Lgals7−/− mice, evaluated by immunofluorescence. Representative images (left panel; CD11b+ red, DAPI blue; bar represents 100 µm) and determination of CD11b+ cells (right panel; mean ± SEM; 3 independent experiments) are shown. G Percentage of CD11b+Gr1+ cells in papillomas from Tg46, WT and Lgals7−/− mice, evaluated by flow cytometry (mean ± SEM; 3 independent experiments). H Immune cell populations in tumor draining lymph nodes (dLN) from Tg46, WT and Lgals7−/− mice at the end point of carcinogenesis protocol, analyzed by flow cytometry. Percentage of CD11b+, CD4+ CD25+ Foxp3+ and CD8+cells, and CD8+/ CD4+ CD25+ Foxp3+ ratio (mean ± SEM; 4 independent experiments) are shown.

