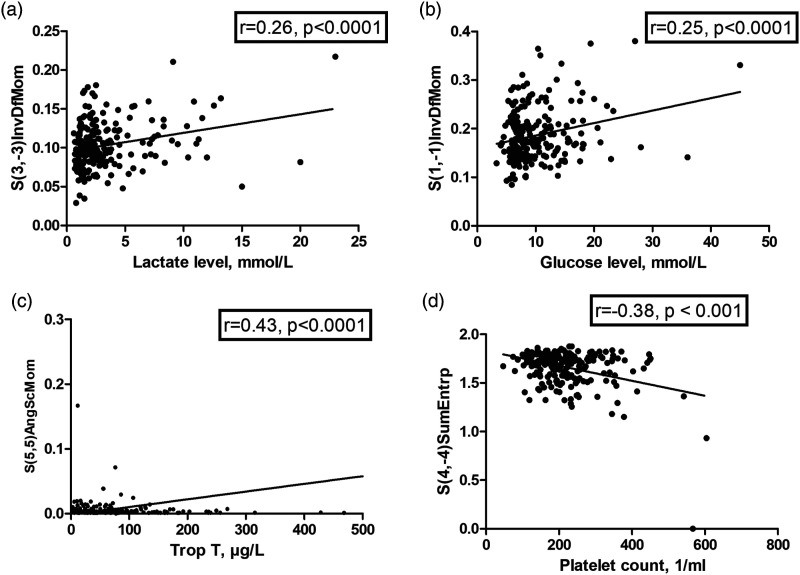
Figure 7.
Correlation between several texture analysis features and serological parameters in patients with acute pulmonary embolism. A. Venous lactate levels and S(3,-3)InvDfMom (r = 0.26, P < 0.001). B. Venous glucose levels and S(1,-1)InvDfMom (r = 0.25, P < 0.001). C. Troponin T and S(5,5)AngScmom (r = 0.43, P < 0.001). D. Platelet count and S(4,-4)SumEntrp (r = −0.38, P < 0.001).

