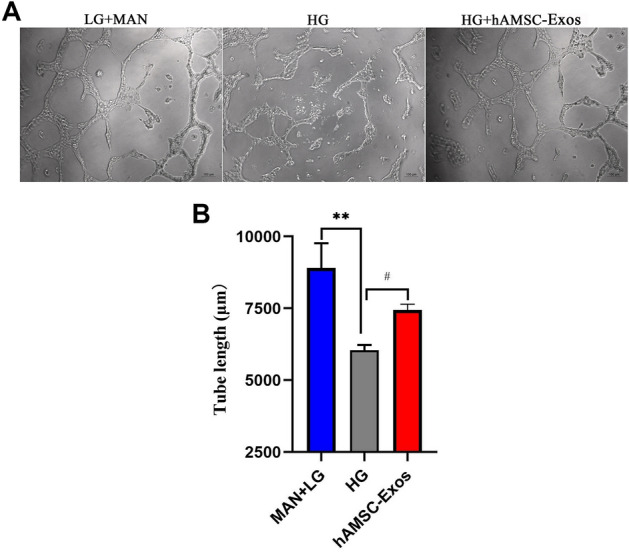
Fig. 4.

A Representative images of tube formation assays in HUVECs treated with hAMSC-Exos or PBS. B Quantitative analysis of the tube lengths of in (A). *p < 0.05, low glucose with mannitol compared with high glucose group; #p < 0.05, hAMSC-Exos compared with high glucose group, n.s. no significance
