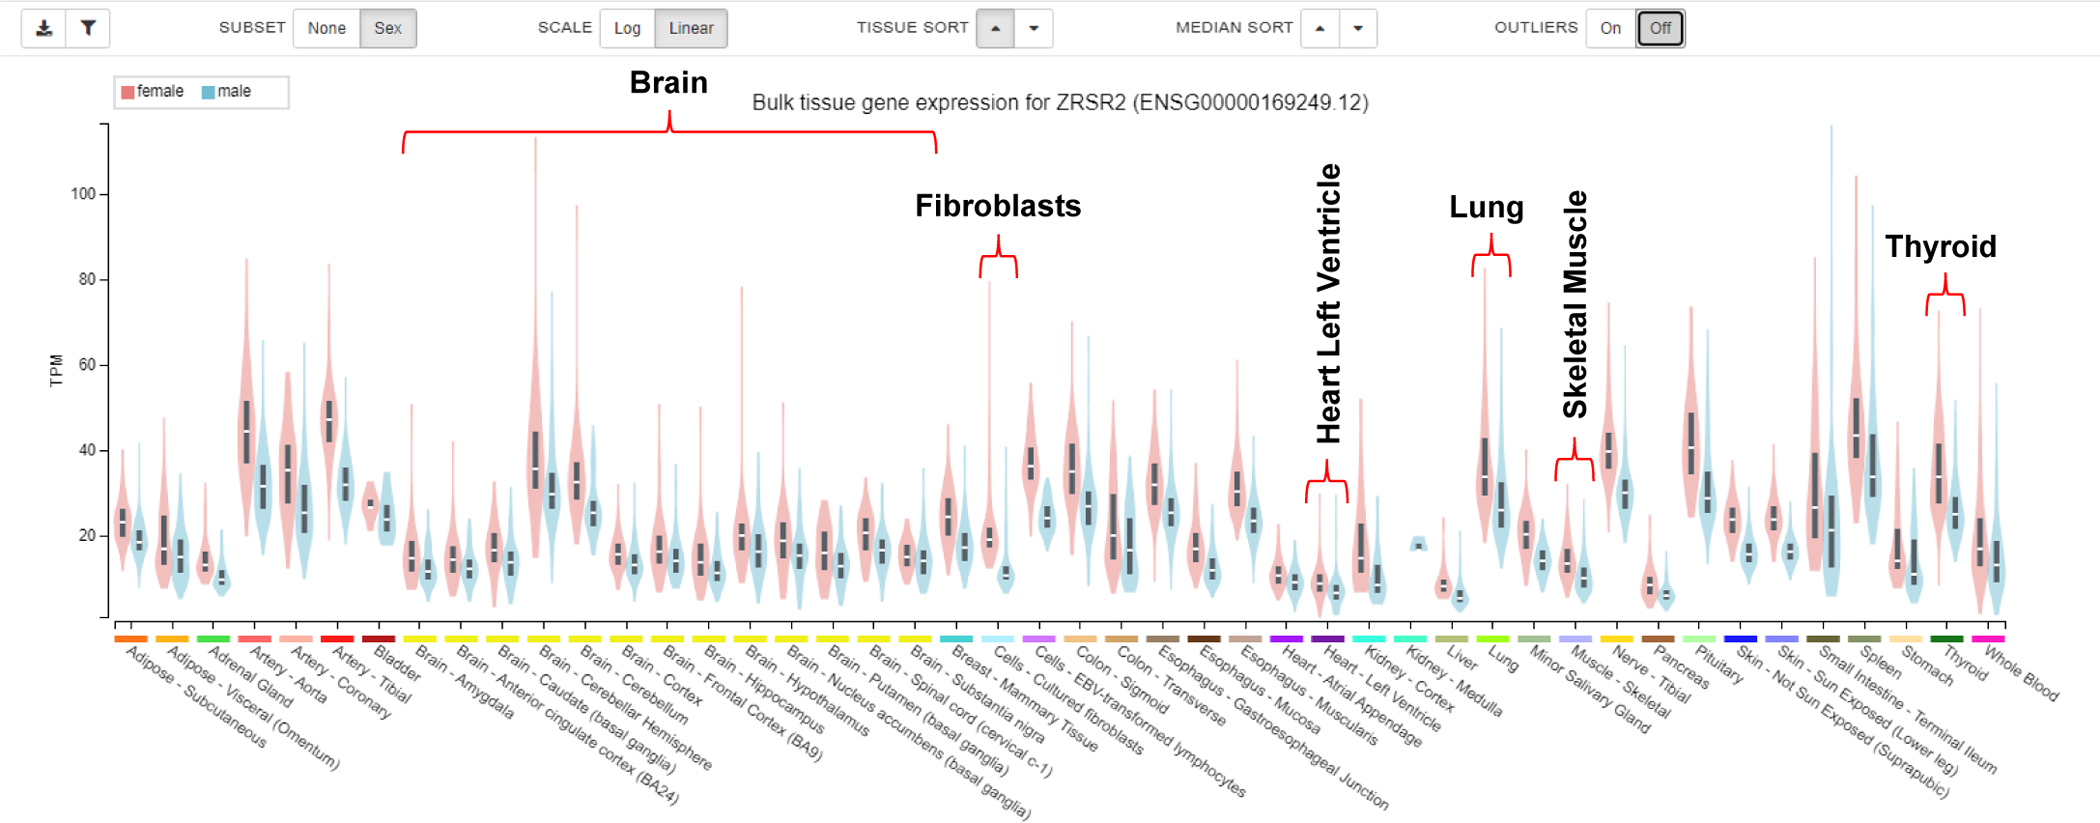
Figure 1. Visualization of Consistently Increased ZRSR2 RNA Abundance in Female Tissues.

A sample of the bulk gene expression data available from https://www.gtexportal.org/home/ is shown. The transcripts per million (TPM) were calculated from a gene model with isoforms collapsed to a single gene. Data is not otherwise normalized. Box plots show the median and 25th and 75 percentiles. The pink and blue plots illustrate the female and male distributions respectively. Hovering over each plot shows the number of samples and median values on the site. The 5 GTEx tissues from Table 2 are bracketed. The many brain regions included in GTEx are marked because spatially complex RNA metabolism occurs in the brain (Fisher & Feng, 2022; Hilgers, 2022; Landinez-Macias & Urwyler, 2021). Data Souce: GTEx Analysis Release v8 (dbGaP Accession phs000424. v8.p2) downloaded April 2022.
