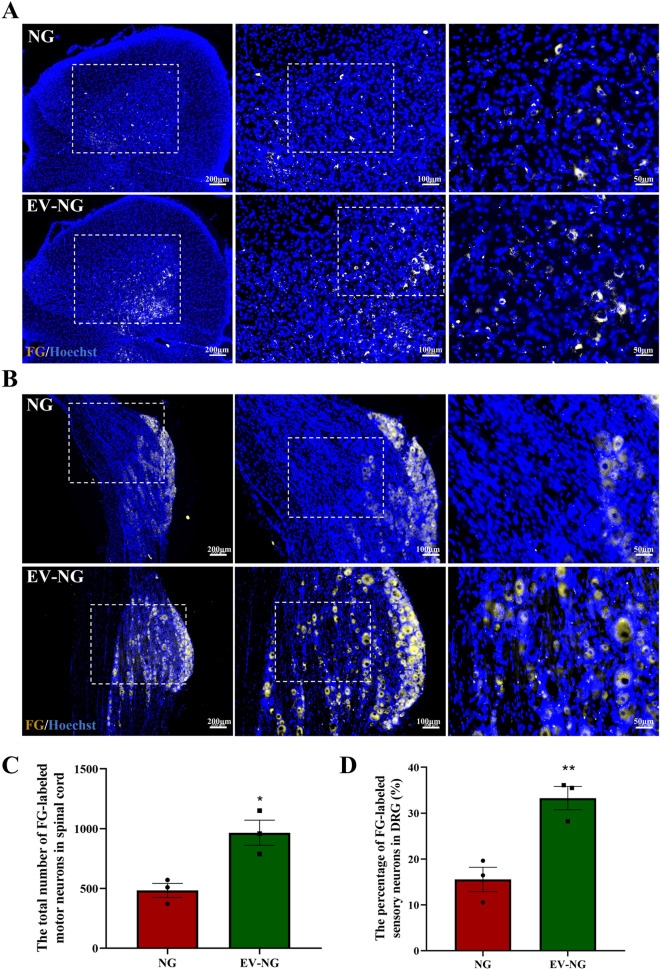
Fig. 3.
Fluorescence photomicrographs of neurons retrogradely labeled with Fluorogold (FG) on the ipsilateral side of surgery. A Representative images of FG-labeled motor neurons (golden) in the spinal cord at 12 postoperative weeks. Scale bar = 200 μm (left), 100 μm (middle), and 50 μm (right). The nucleus was stained with Hoechst (blue). B Representative image of FG-labeled sensory neurons (golden) in the DRGs at 12 postoperative weeks. Scale bar = 200 μm (left), 100 μm (middle), and 50 μm (right). The nucleus was stained with Hoechst (blue). C Comparison of the percentage of FG-labeled motor neurons in the spinal cord between the NG group and EV-NG group (n = 3 in each group). D Comparison of the percentage of FG-labeled sensory neurons in the DRGs between the NG group and EV-NG group (n = 3 in each group). All data are presented as mean ± SEM. ∗ p < 0.05, **p < 0.01 with unpaired Student’s t-test (two-sided)

