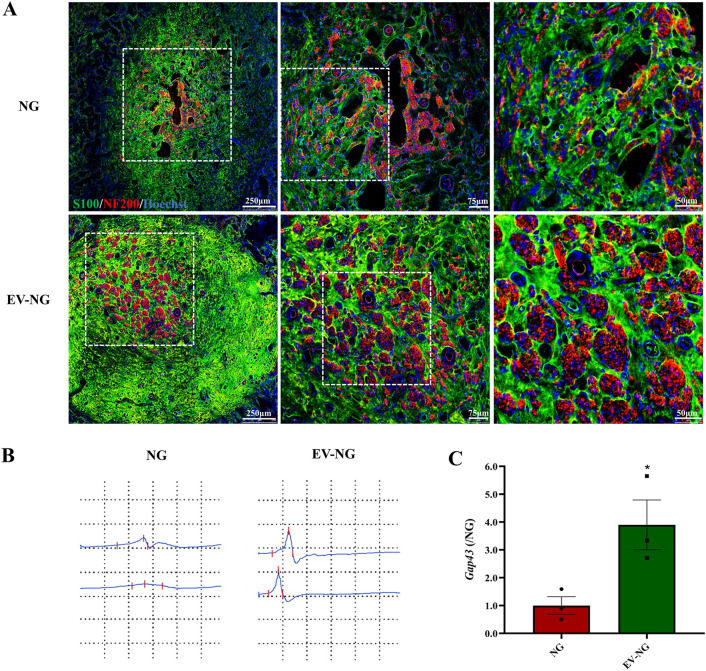
Fig. 4.
Morphological and functional analysis of regenerated nerves. A At 12 postoperative weeks, immunofluorescent staining images of the cross-sections from the middle portion of the sciatic nerve were taken by a Leica confocal microscope. The myelin sheath was stained with S100 (Green) and axons with NF200 (red). The nucleus was shown with Hoechst 33,258 staining (blue). Scale bar = 250 μm (left), 75 μm (middle), and 25 μm (right). B Representative CMAP images of the sciatic nerve were recorded at 12 weeks post implantation of NG or EV-NG with an intensity of 1 mA. C The expression of Gap43 in the regenerated nerves measured by qRT-PCR (n = 3 in each group). The expression in the NG group was arbitrarily taken as 1. All data are presented as mean ± SEM. *p < 0.05 with unpaired Student’s t-test (two-sided)

