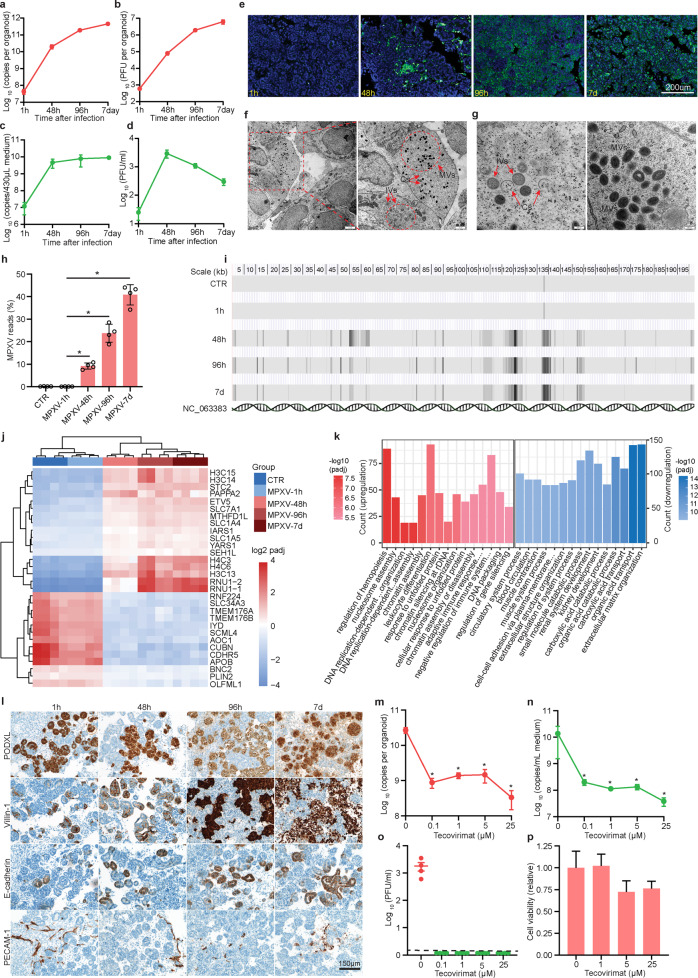
Fig. 1. MPXV infection in human kidney organoids.
a Quantification of viral DNA levels and (b) infectious viral titers in organoids (n = 4). c Quantification of viral DNA levels and (d) infectious viral titers in the culture medium (n = 4-6). e Visualization of MPXV by immunostaining organoids with an antibody against the virions (green). Blue is DAPI staining of nuclei. Scale bar: 200 μm. f Transmission electron microscopy visualized the MPXV particles in organoids. Scale bar: left, 2 μm; right, 1 μm. g The assembly steps of MPXV start from crescents (Cs), proceed to immature virions (IVs), and finally form the mature virions (MVs). Scale bar: 200 nm. h The percentages of mapped MPXV transcripts in infected organoids. i MPXV transcripts mapped to the locations in viral genome. j The top 30 significantly regulated genes by MPXV infection. k Top 30 significantly regulated pathways by gene ontology analysis at day 7 post-inoculation, compared with the uninfected group. Red: upregulated; blue: downregulated. l Immunohistochemical staining of kidney organoid sections for glomerular structures (PODXL), proximal tubular structures (Villin-1), distal tubular structures (E-cadherin) and endothelial structures (PECAM-1) at 1 h, 48 h, 96 h and 7 d after inoculation with MPXV. m Quantification of MPXV DNA level in organoids (n = 4) and (n) culture medium (n = 4) 7 days after tecovirimat treatment. o Quantification of infectious titters in culture medium 7 days after tecovirimat treatment. Infectious titers were undetectable in the treatment groups (n = 4). p Cell viability of kidney organoids after treatment by tecovirimat for 7 days (n = 4–5). h: hour post-inoculation; d: day post-inoculation. Data are presented as means ± SEM. *P < 0.05, Mann–Whitney test.

