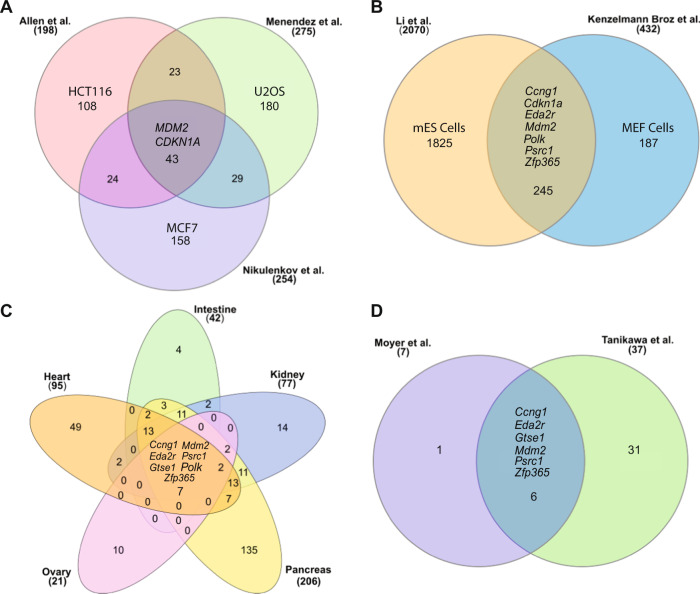
Fig. 2. Molecular profiling of the p53 transcription factor.
A Comparison of upregulated genes from the Allen et al., Menendez et al. and Nikulenkov et al. data sets that identify common p53 targets in cancer cell lines treated with Nutlin 3a. B Comparison of Li et al., and Kenzelmann Broz et al. data sets from mouse embryonic stem (mES) cells and mouse embryonic fibroblasts (MEFs) to identify common p53 targets. C Identification of 7 common genes activated by p53 gene in murine tissues. Rederived from Moyer et al. [73]. D Comparison of Moyer et al., and Tanikawa et al. data sets to identify common p53 targets. http://www.interactivenn.net/ was used to generate the Venn diagrams [101]. Some shared common genes are listed. Numbers denote either the total number of genes expressed (in parentheses) or the number of unique/shared genes.

