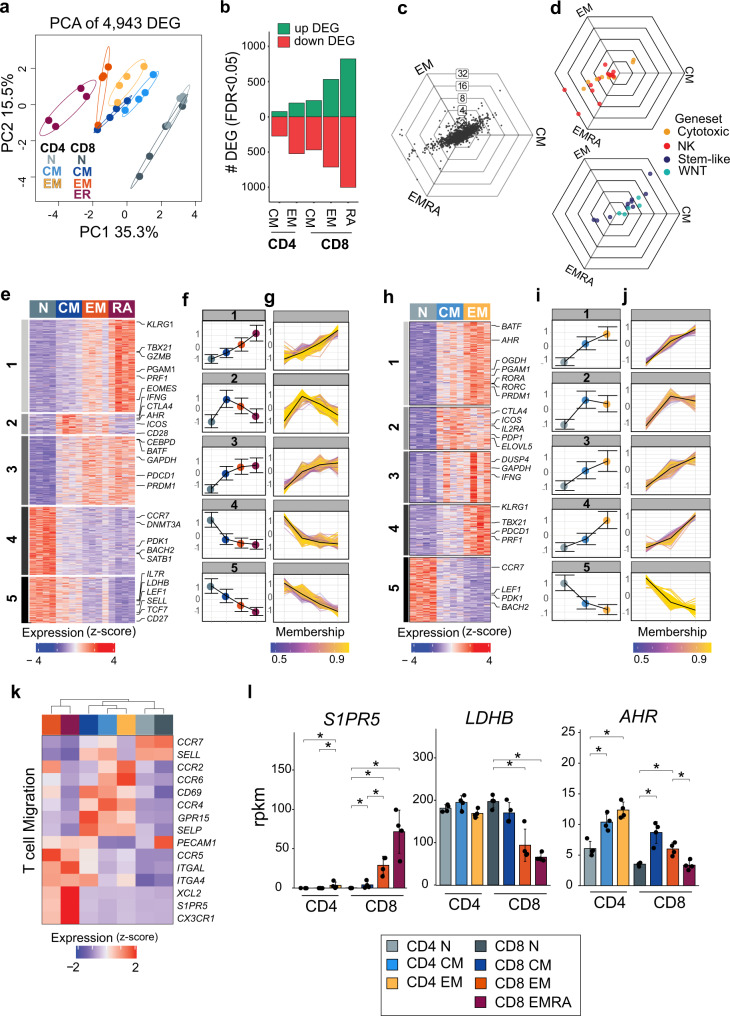
Fig. 2. Resting MTC subsets in peripheral blood show progressive levels of differentiation from naïve.
a Principal component (PC) analysis plot of DEG from RNA-sequencing data showing each sample separated by first two components. b Bar plot representing number of up and downregulated DEG for each memory subset compared to naïve T cells. c Three-way representation of DEG expression between CD8+ TCM, TEM, and TEMRA. Each dot represents a single DEG; dots falling directly on an axis represent exclusive upregulation in each group, and concentric rings represent degree of log2-fold-change differences between groups. d Overlay of C with genes belonging to two gene sets (NK cell and cytotoxicity) upregulated in CD8+ TEM and TEMRA cells, or genes representing WNT-Beta catenin and stem-like T-cell expression are upregulated in CD8+ TCM cells. e, h Heatmaps showing DEGs in CD8 + or CD4 + naïve and memory subsets clustered by fuzzy c-means clustering. Highlighted examples for each module are listed. f, i Line plots showing mean expression of all genes in each cluster by subset (error bars represent ±1 SD). g, j Line plots showing expression of individual genes in cluster colored by membership score for respective cluster. Average across modules shown by black line. k Heatmap of selected genes representing differences in expression of migration-related genes. Data represents the mean expression of each cell subset. l Gene expression bar plots showing reads per kilobase million (rpkm) for the indicated genes. Data are plotted as mean ± SD; asterisks indicate DEG as detected by DESeq2 algorithm.

