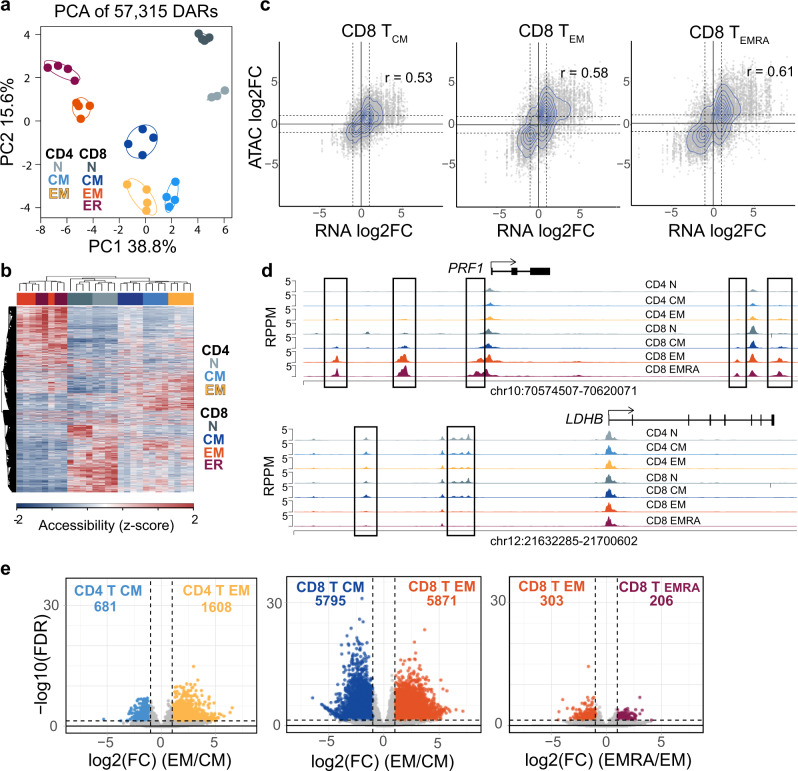
Fig. 4. Effector-memory subsets exhibit a greater number of changes to chromatin accessibility compared to central memory subsets.
a PCA plot of DAR from ATAC-seq data. b Heatmap displaying DAR z-score normalized across samples. c Scatter plots showing log2-fold changes (FC) of MTC subsets vs. naïve T cells of DEG (x-axis) mapped to DAR (y-axis) for CD8+ TCM, CD8+ TEM, and CD8+ TEMRA. Dotted lines represent ±1 log2FC. d Genome plots showing the average accessibility levels in each of the memory subsets and naïve T cells at the indicated locus. Data represent the mean of each cell type. DAR are highlighted by boxes. e Volcano plots showing DAR that are more accessible in CD4+ TEM vs CD4+ TCM, CD8+ TEM vs CD8+ TCM, and CD8+ TEMRA vs CD8+ TEM. Number of DAR in each direction are totaled at the top of each plot.

