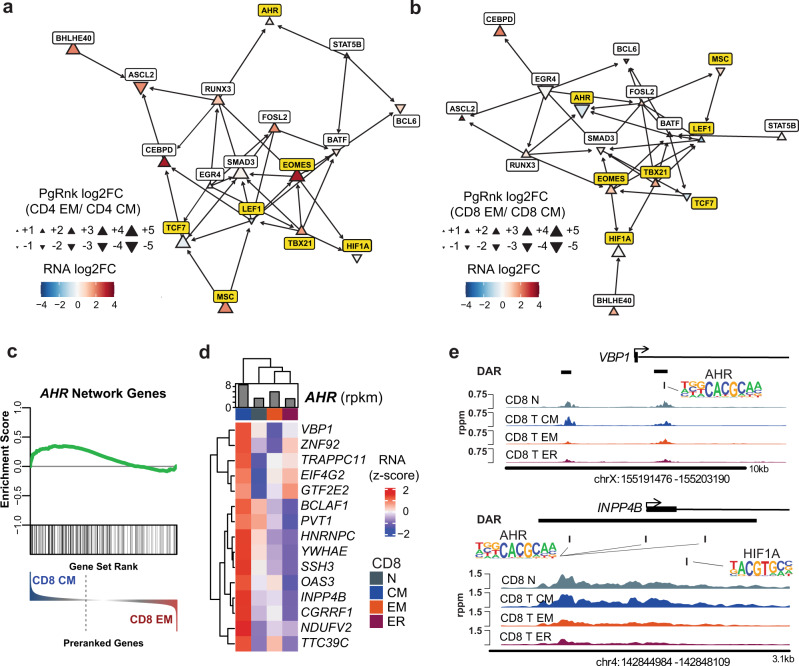
Fig. 6. bHLH transcription factors AHR and HIF1A distinguish CD8 + TCM and TEM.
a Network diagram showing transcription factors in CD4+ MTC highly ranked by PageRank and associated connections to other TF. Triangles represent log2FC (size) and direction (orientation) of PageRank as indicated in the legend. Arrows represent putative regulation via nearby binding motifs. AHR, HIF1A, MSC, and other memory-subset defining TFs are highlighted in yellow. b Network diagram as in (a) for CD8+ TCM and TEM. c GSEA plot using gene set made up of genes putatively regulated by AHR showing enrichment in CD8+ TCM vs. TEM DEG. d Heatmap of leading-edge genes from GSEA most highly upregulated in TCM. Bar plot indicates normalized expression of AHR in rpkm. Data represent the mean expression of each cell subset. e Genome plots showing the average accessibility levels in each of the CD8+ memory and naïve T cells at the indicated locus. DAR are highlighted by black horizontal bars, with AHR and HIF1A binding motifs at indicated locations. Data represent the mean of each cell type.

