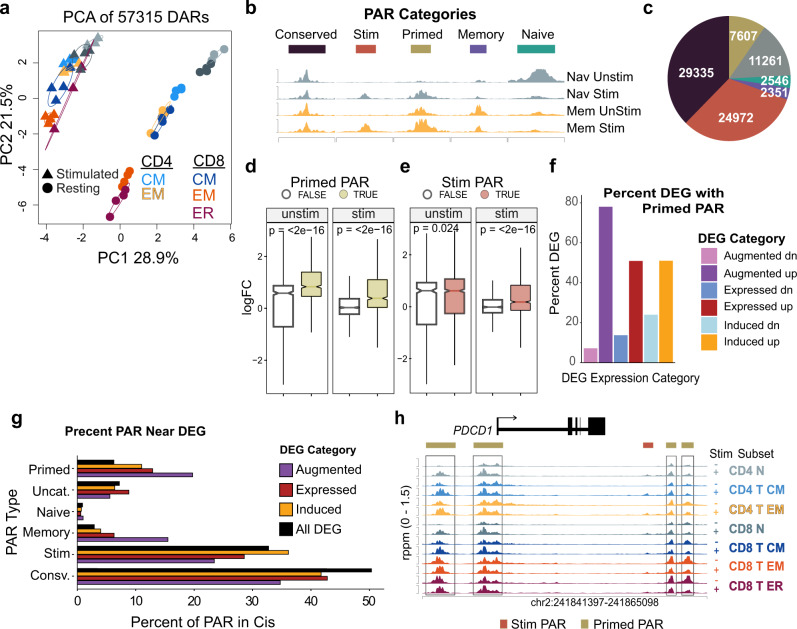
Fig. 8. Accessible chromatin regions primed from previous activation are associated with augmented gene expression of MTC.
a PC analysis plot of DAR between unstimulated and stimulated memory and naïve T-cell samples. b Schematic illustrating examples of PAR categorized by accessibility in both unstimulated (Unstim) and stimulated (Stim) states in memory (Mem) and naïve (Nav) T cells. c Pie chart showing number of DAR peaks in each category. d Box plot showing log2FC of DEG found to be significant in either unstimulated memory vs unstimulated naïve T cells or stimulated memory vs stimulated naïve T cells. Boxes colored in gold represent log2FC distribution of genes with at least one primed-PAR mapped to a differential gene locus. Notches represent median values, box limits represent upper and lower quanrtiles. Lines represent range. e Box plot as in (d). Boxes colored in red represent log2FC distribution of genes with at least one stimulation-PAR mapped to a differential gene locus. f Bar plot showing the percent of genes belonging to either expressed, induced, or augmented expression categories with at least one primed-PAR nearby. g Bar plot showing the proportion of each PAR type compared to all peaks surrounding DEG belonging to each of the different memory-specific expression categories. The All DEG category represents all genes differentially expressed compared to naïve T cells. h Genome plot showing accessibility data around the PDCD1 locus. DAR are indicated by horizontal bars colored according to PAR category above tracks. Primed-PAR are highlighted by boxes.

