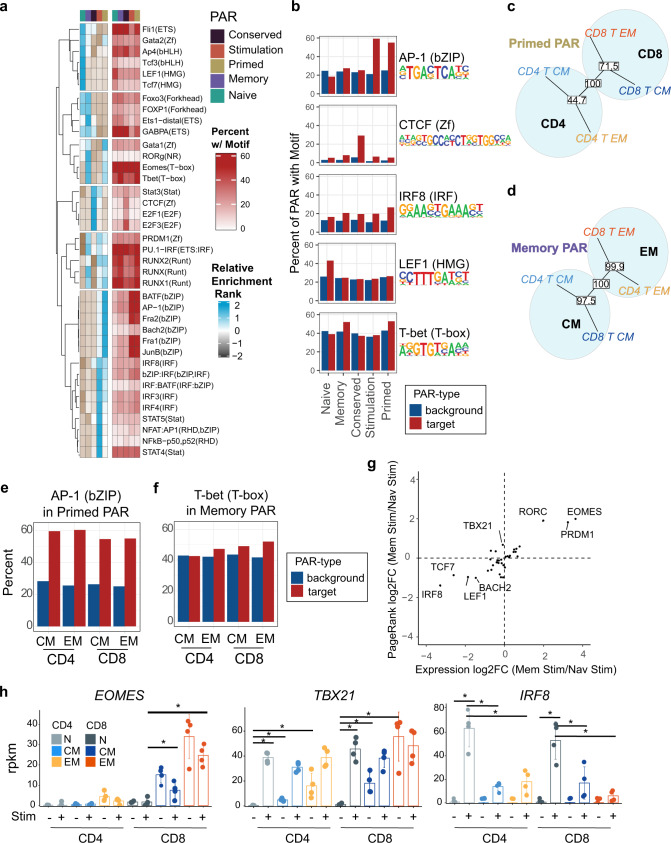
Fig. 9. Transcription factor motif and expression patterns differentiate between memory and naïve T-cell response to stimulation.
a Heatmaps of enrichment rankings for transcription factor binding motifs in each of the PAR categories for CD8+ TEM cells and percent of PAR with the target motif for the selected example motifs. b Bar plots showing percent of input peaks containing indicated motifs (red) and percent background regions containing motif (blue) for five motifs representing enrichment specific to one or more of the PAR categories. c, d Phylogenetic dendrogram of transcription factor binding motif enrichment ranks found within Primed (c) and Memory (d) PAR compared across MTC subset groups. The reproducibility of tree structures was tested using bootstrapping analysis with the percent reproducibility shown in white boxes for each node. e, f Bar plots showing examples of differences in percent input PAR containing the indicated motifs across MTC subsets for primed (e) and memory (f) PAR. g Scatter plot showing log2FC of RNA expression (x-axis) vs PageRank statistic (y-axis) of CD8+ TEM compared to naïve T cells for transcription factors known to bind to motifs found to be enriched in primed or memory-PAR. h Bar plot showing rpkm values for indicated genes in both resting and stimulated samples. Error bars indicate ±SD. Asterisks indicate relevant significant differences as detected by DESeq2 algorithm.

