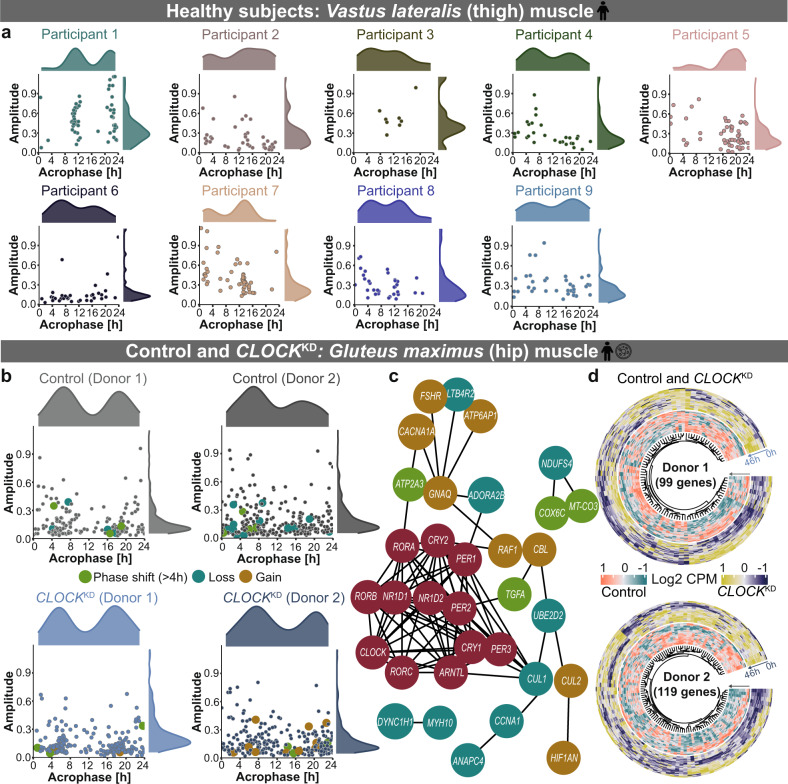
Fig. 2. Genes of interest exhibit circadian properties in human healthy muscle tissue and cells which are altered upon CLOCKKD.
Scatter plot depicts the distribution of circadian (~24 h) genes of interest in (a) muscle biopsies collected from nine healthy participants and (b) myotubes cultured cells from two healthy control donors (upper panel) and siRNA transfected CLOCKKD cells (lower panel). c STRING network depicts the interaction between differential rhythmic genes due to CLOCKKD and the core-clock genes (red circles). d Circular heatmap visualizes the differentially expressed genes of interest due to CLOCKKD vs. WT in donor 1 (upper panel) and donor 2 (lower panel).

