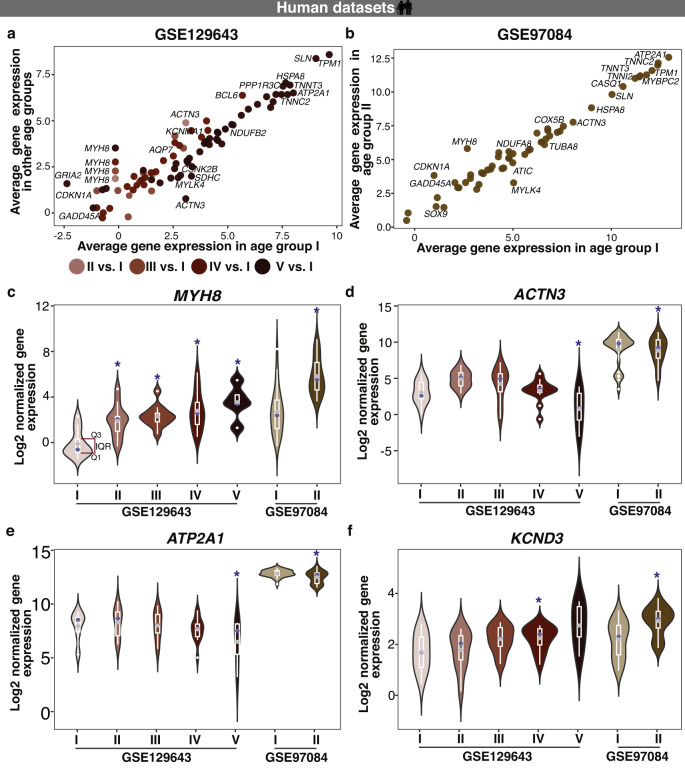
Fig. 5. Aging on Earth results in differential expression of clock- and skeletal muscle-related genes in humans.
Bubble plots represent (a) the average gene expression for differentially expressed genes in at least one age-group (Age group II = 35–49 years, III = 50–64 years, IV = 65–79 years, and V = 80 + years vs. Age group I = 20–34 years; GSE129643), that were also differentially expressed (b) in an independent age-related dataset (Age group II = 65–75 years vs. Age I = 20–30 years, GSE97084). Within the subset of differentially expressed genes of interest (c) MYH8 exhibited age associated changes in the expression profile in all age groups vs. age group I (20–34 years; GSE129643) and in age group II (65–75 years) vs. I (20–30 years) in GSE97084 dataset, (d) ACTN3 and (e) ATP2A1 showed significant downregulation in the Age group V (80 + years; GSE129643) and in age group II (65–75 years; GSE97084) compared to their reference groups, and (f) KCND3 showed significant upregulation in age group IV (65–79 years; GSE129643) and in age group II (65–75 years; GSE97084) vs. their reference groups (* represents the age groups that showed significant differential expression vs. reference group; Q1: 1st quartile; Q3: 3rd quartile; top and bottom whiskers: upper and lower adjacent values calculated as Q3 + 1.5IQR and Q1–1.5IQR, respectively; grey dots represent the mean value and blue dots represent the median value).

