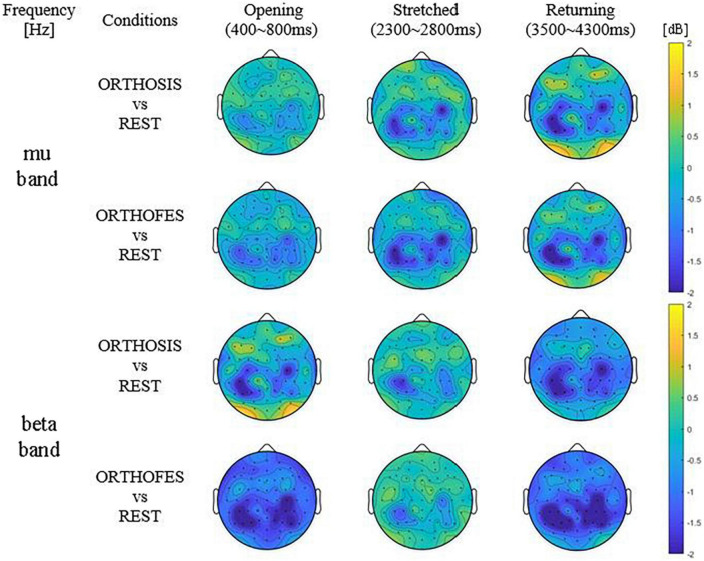
FIGURE 3.
Averaged differential power values of all included participants’ data. Topography presenting the power changes in ORTHOSIS and ORTHOFES averaged (N = 8). The frequency band of each subject was selected from the above information (Table 1). The power changes in ORTHOSIS and ORTHOFES were compared to REST. The pronounced power reduction was observed in contralateral S1 and ipsilateral M1 and S1—the color bars fixed scale (–2 to 2 dB) for comparisons between conditions and phases. (S1 = primary somatosensory cortex, M1 = primary motor cortex). Yellow indicates ERS (power increase in dB), and blue shows ERD (power decrease in dB) compared with REST, as expressed in the color bar.

