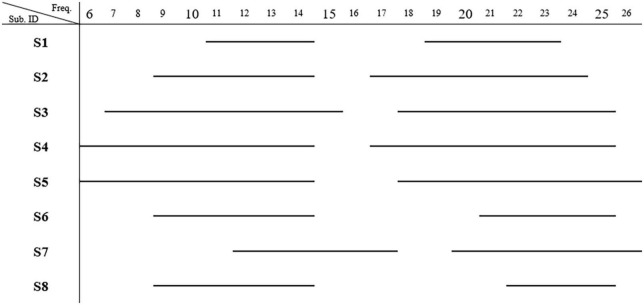
FIGURE 4.
Most representative frequency bands. The frequencies present significant band power changes in each subject. Two frequency bands showing significant power changes (p < 0.01) were observed (N = 8) after bootstrap analysis. The mu band was 11.3 ± 2.6 (mean ± SD) Hz, and the beta band was 21.8 ± 2.4 Hz.

